ETH-USD Trading Predictions
1 Day Prediction
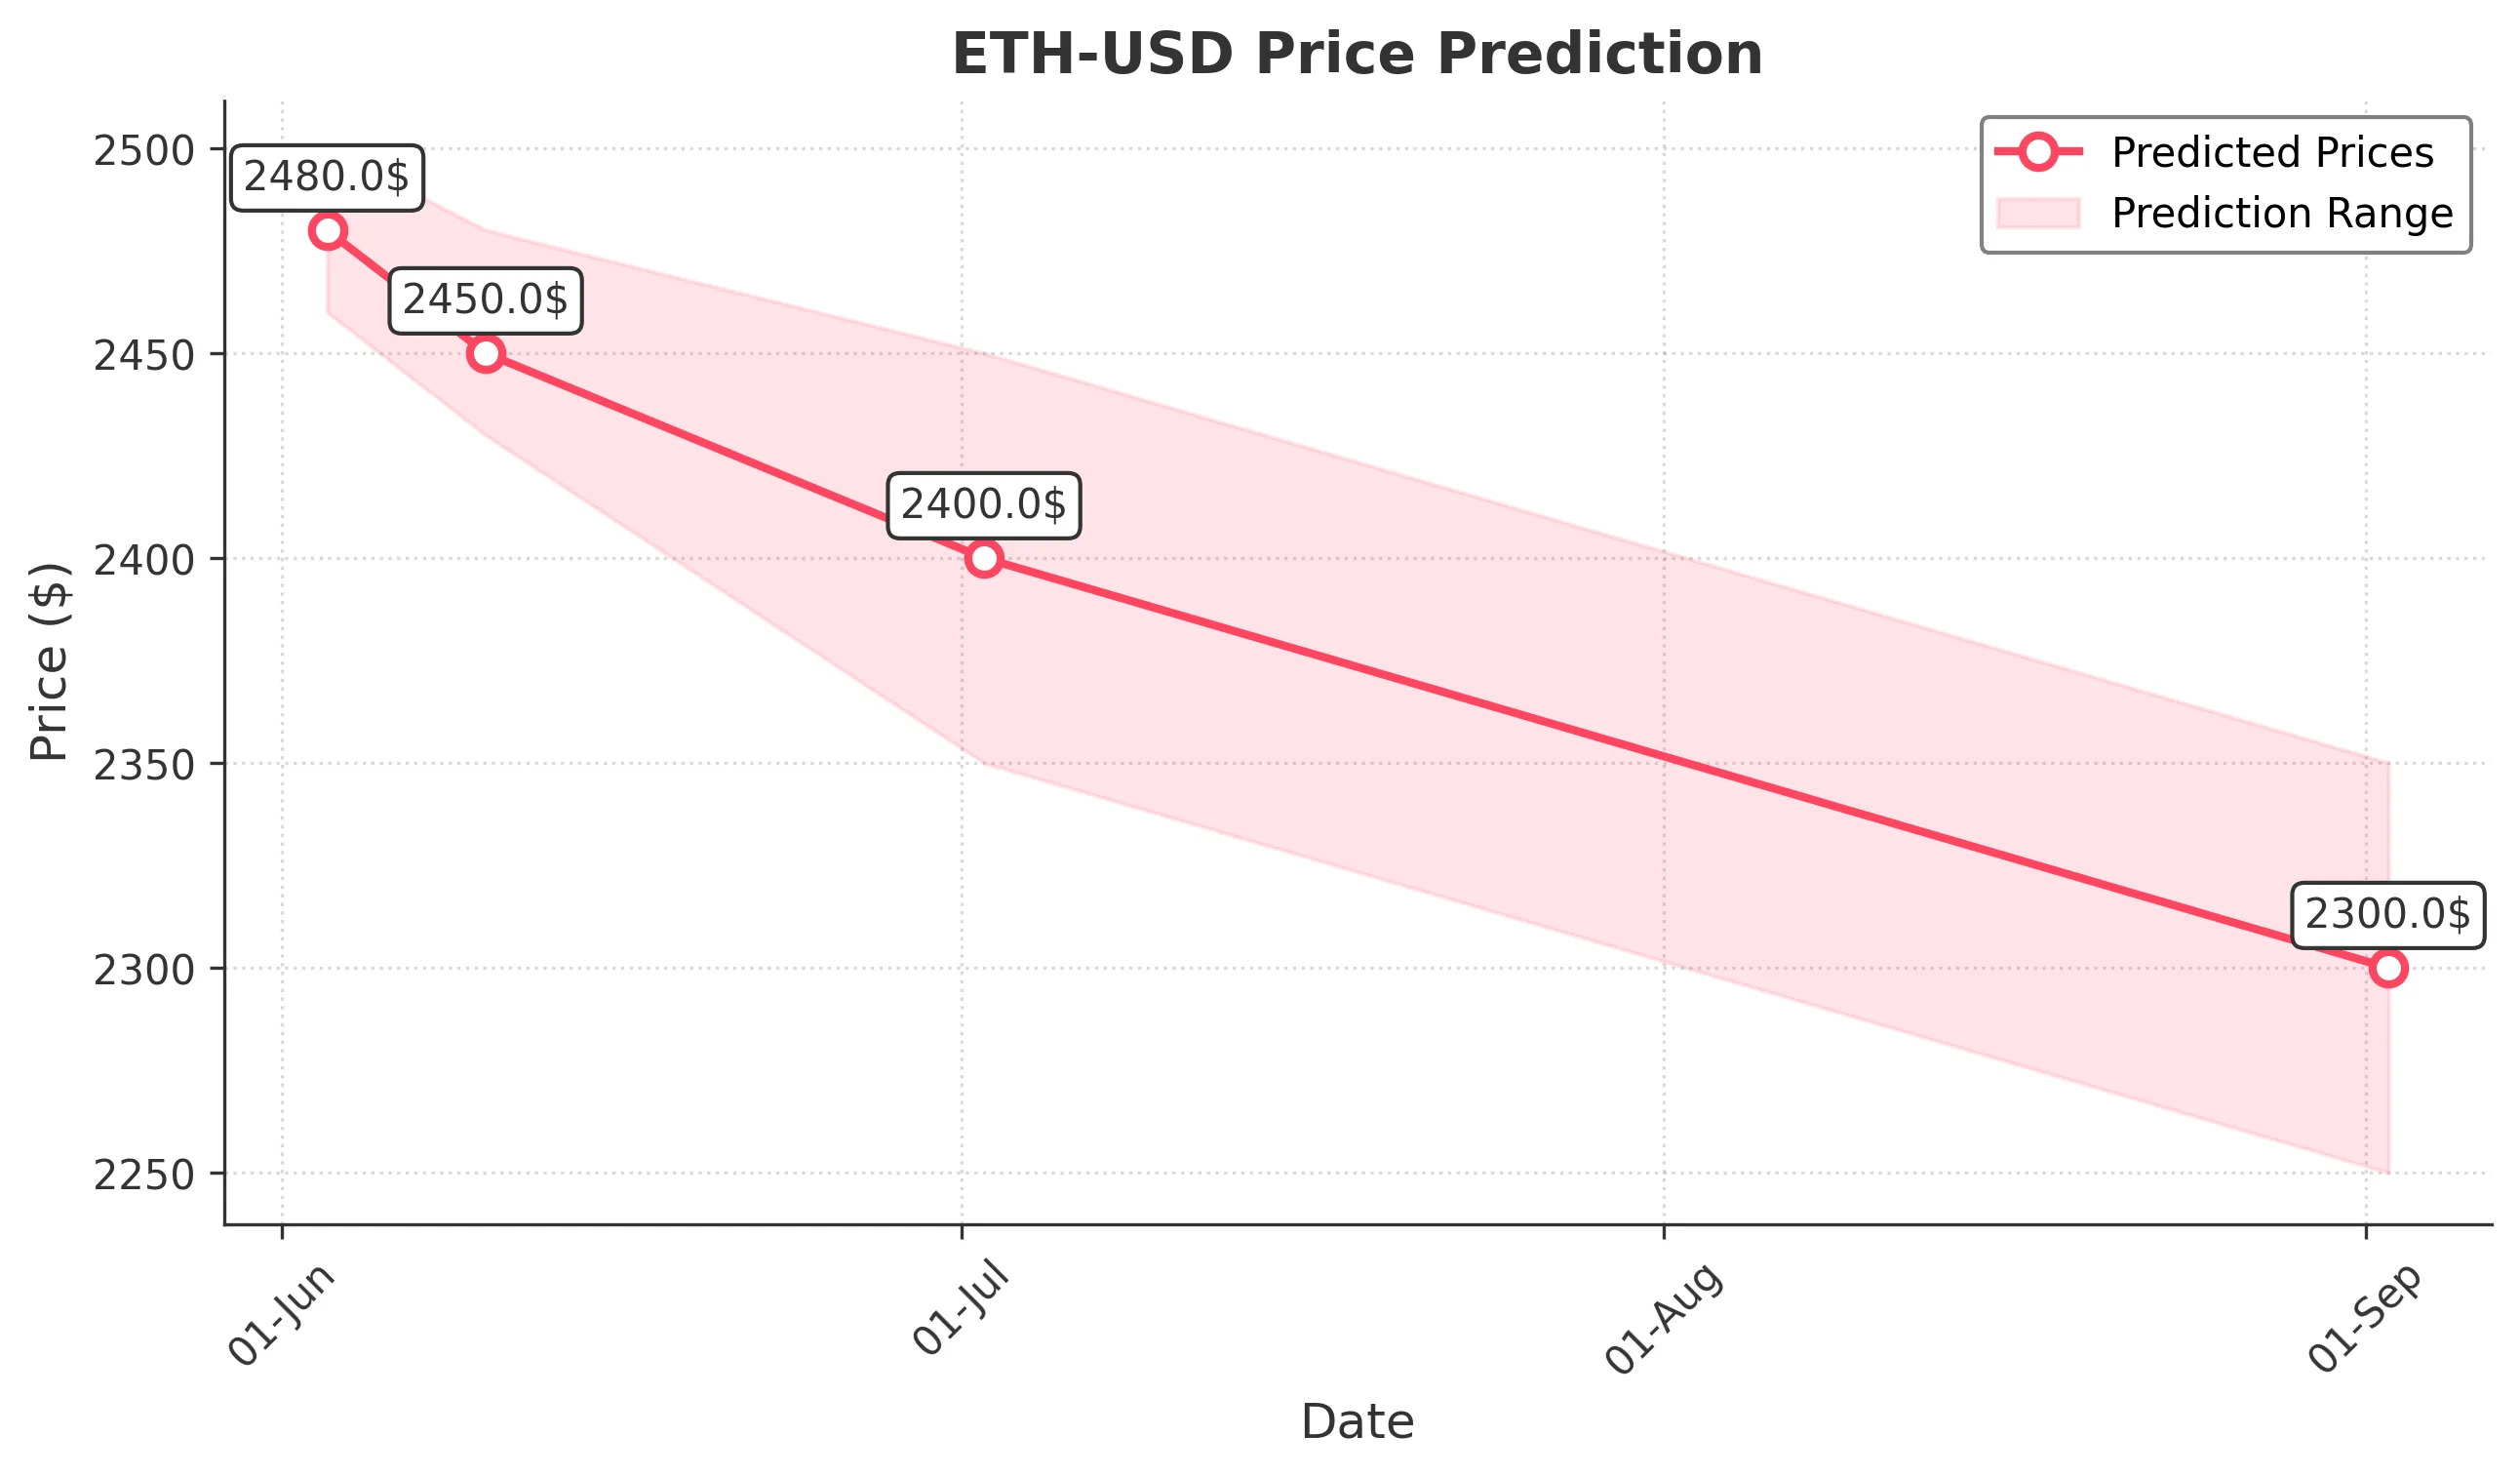
Target: June 3, 2025$2480
$2475
$2500
$2460
Description
The price is expected to stabilize around 2480.0 due to recent bullish momentum, but resistance at 2500.0 may limit upward movement. RSI indicates overbought conditions, suggesting a potential pullback.
Analysis
The past 3 months show a bullish trend with significant price recovery from lows. Key resistance at 2500.0 and support around 2400.0. Volume spikes indicate strong interest, but RSI suggests caution.
Confidence Level
Potential Risks
Market volatility and external news could impact the price significantly, leading to unexpected fluctuations.
1 Week Prediction
Target: June 10, 2025$2450
$2470
$2480
$2430
Description
A slight decline to 2450.0 is anticipated as profit-taking may occur after recent gains. The MACD shows bearish divergence, indicating potential weakness in momentum.
Analysis
The stock has shown a recovery trend, but recent price action suggests a potential consolidation phase. Key support at 2400.0 remains critical.
Confidence Level
Potential Risks
Unforeseen macroeconomic events or regulatory news could lead to increased volatility and affect the prediction.
1 Month Prediction
Target: July 2, 2025$2400
$2450
$2450
$2350
Description
A further decline to 2400.0 is expected as bearish sentiment may take hold. The Bollinger Bands indicate potential for a breakout, but current trends suggest downward pressure.
Analysis
The overall trend appears to be shifting towards bearish, with significant resistance at 2500.0. Volume analysis shows decreasing interest, indicating potential weakness.
Confidence Level
Potential Risks
Market sentiment can shift rapidly, and any positive news could reverse the bearish outlook.
3 Months Prediction
Target: September 2, 2025$2300
$2350
$2350
$2250
Description
A continued downtrend to 2300.0 is likely as bearish market conditions persist. The ATR indicates increasing volatility, suggesting potential for larger price swings.
Analysis
The stock has shown signs of weakness, with key support levels being tested. The overall sentiment is bearish, and external factors could further influence price action.
Confidence Level
Potential Risks
Economic indicators and market sentiment could change, leading to unexpected price movements.