ETH-USD Trading Predictions
1 Day Prediction
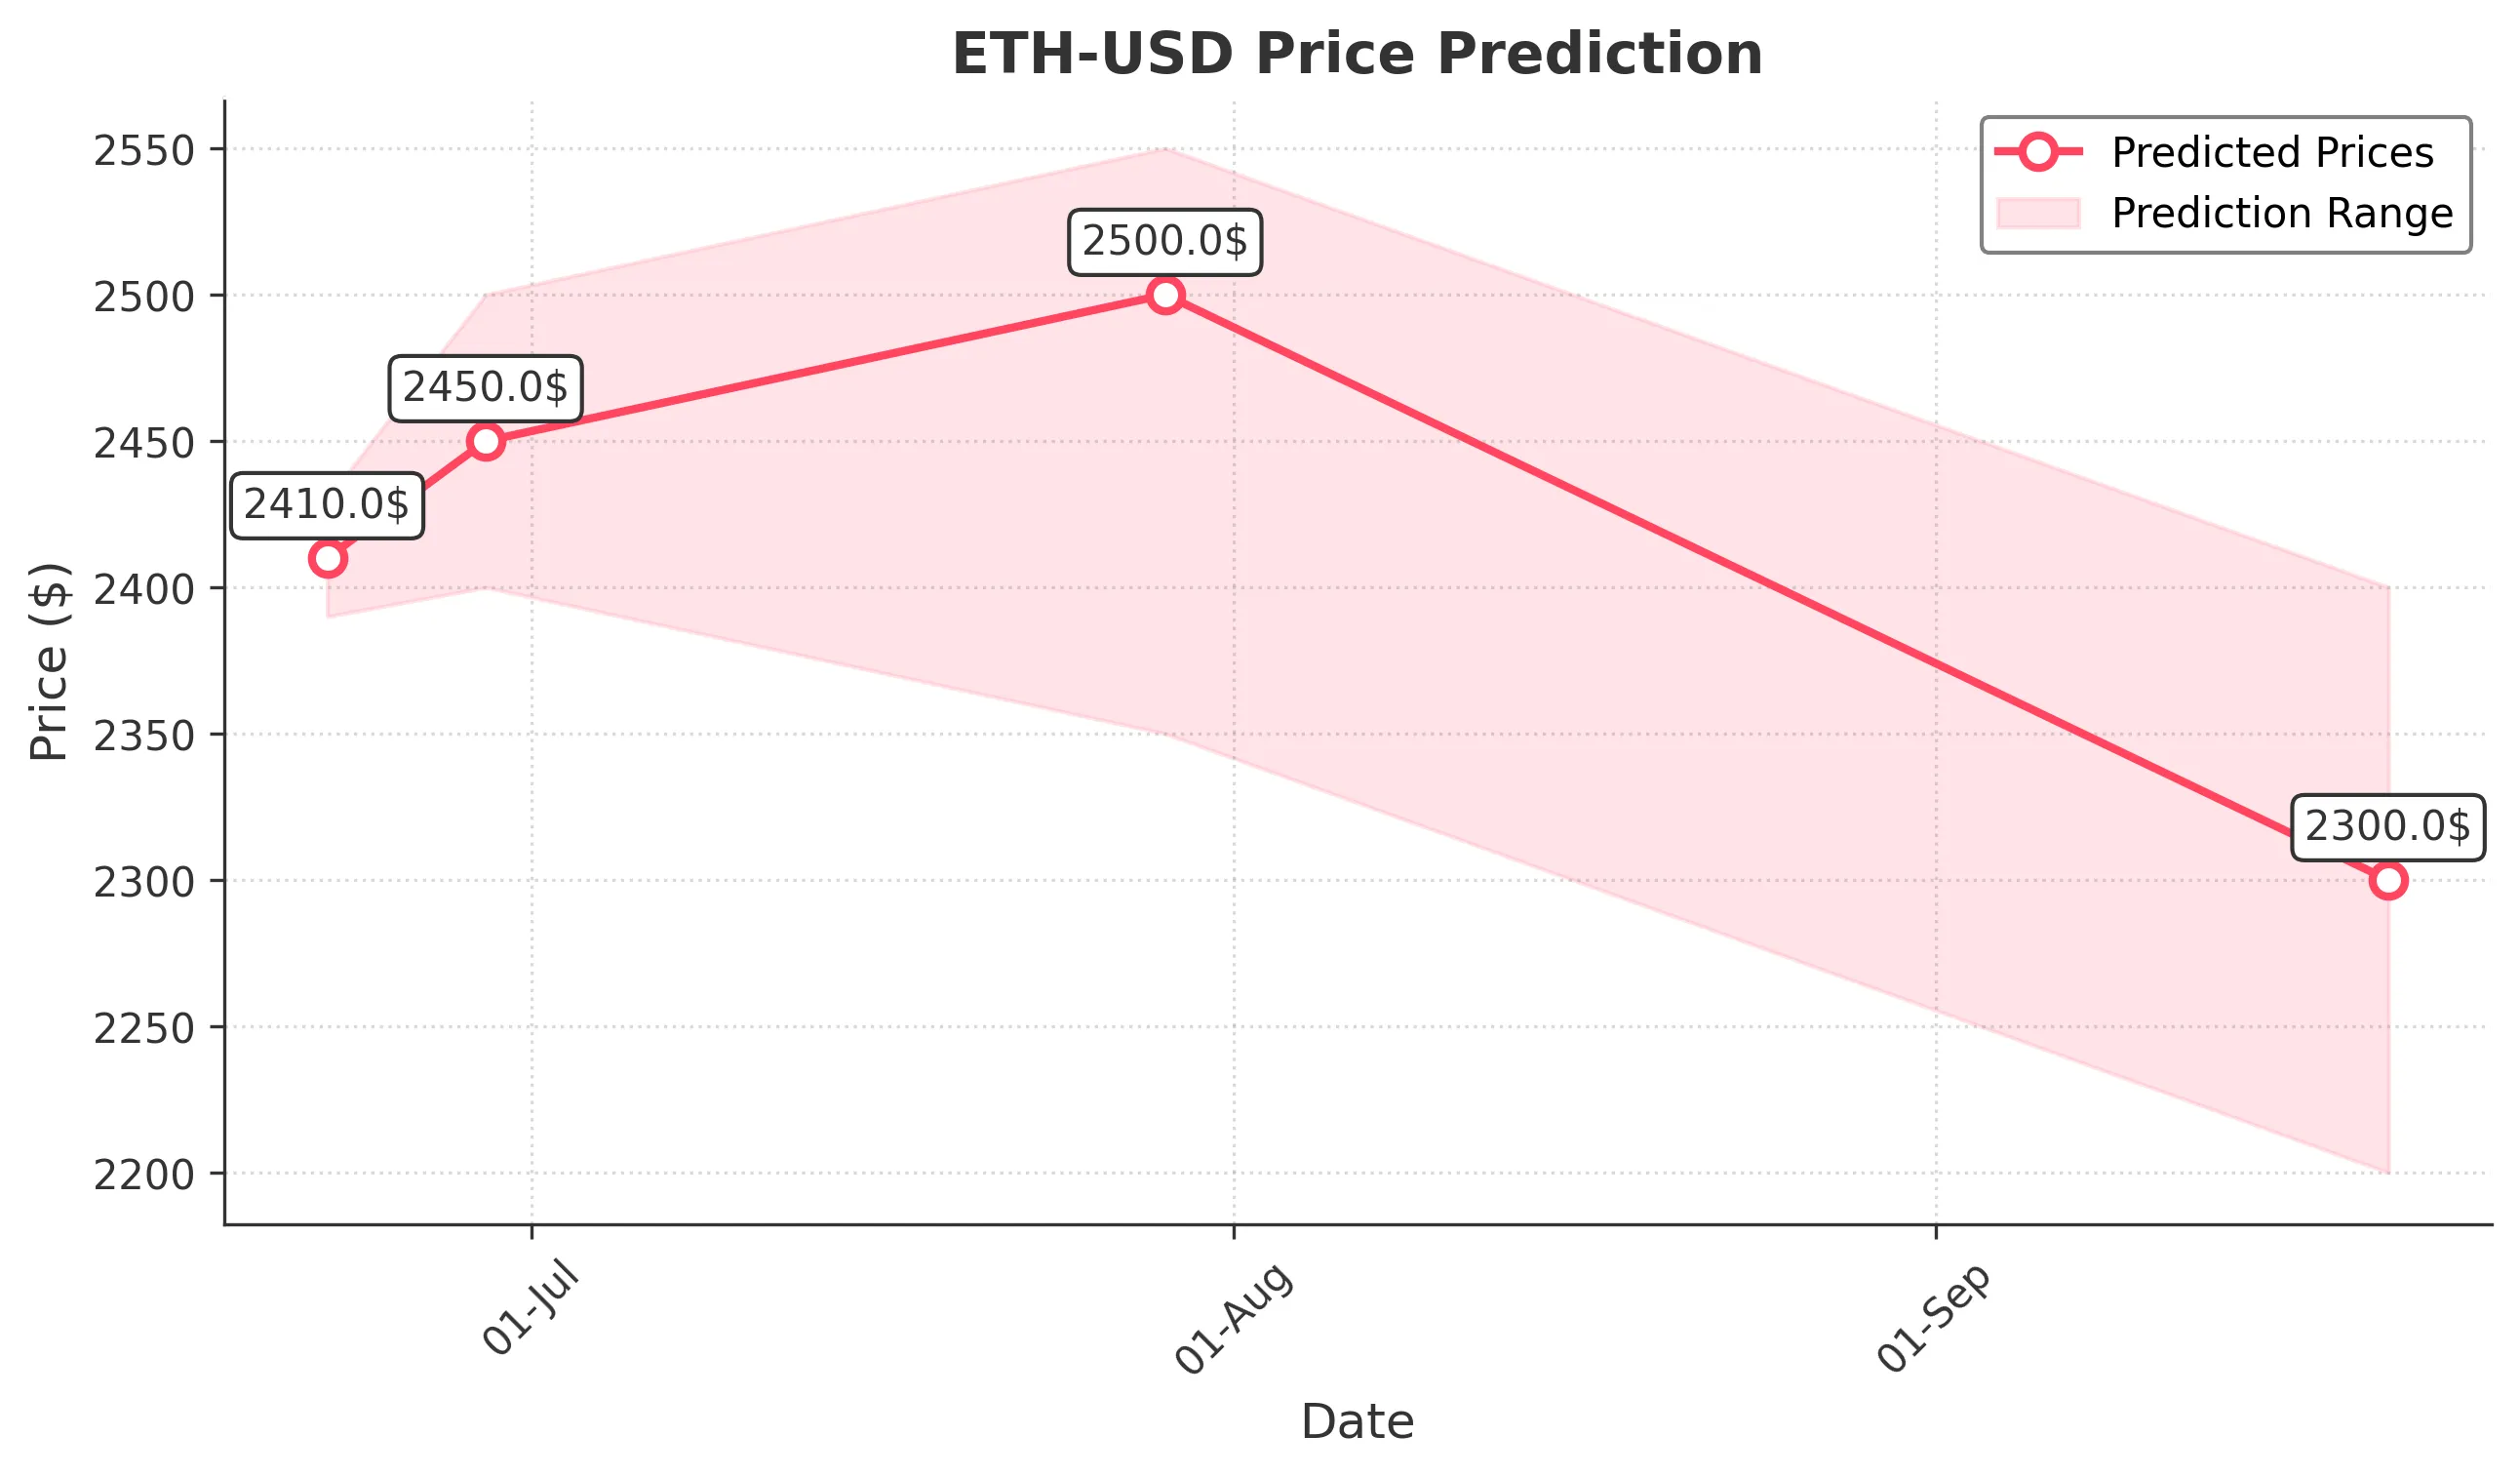
Target: June 22, 2025$2410
$2405
$2430
$2390
Description
The price is expected to stabilize around 2410.0, supported by recent bullish momentum. However, the RSI indicates overbought conditions, suggesting potential pullbacks. Volume remains high, indicating strong interest.
Analysis
The past 3 months show a bullish trend with significant price increases, particularly in early June. Key resistance at 2600.0 and support around 2400.0. RSI indicates overbought conditions, while MACD shows bullish momentum. Volume spikes suggest strong interest.
Confidence Level
Potential Risks
Potential for volatility due to market sentiment shifts or macroeconomic news could impact the prediction.
1 Week Prediction
Target: June 29, 2025$2450
$2425
$2500
$2400
Description
Expecting a slight upward trend to 2450.0 as market sentiment remains positive. However, the RSI indicates potential overbought conditions, which could lead to corrections. Volume trends suggest sustained interest.
Analysis
The stock has shown strong upward momentum, but recent volatility raises concerns. Key support at 2400.0 and resistance at 2500.0. Technical indicators show mixed signals, with MACD indicating potential bullish divergence.
Confidence Level
Potential Risks
Market corrections or negative news could lead to unexpected price drops.
1 Month Prediction
Target: July 29, 2025$2500
$2450
$2550
$2350
Description
Predicted close at 2500.0 reflects continued bullish sentiment, but potential resistance at 2550.0 may limit gains. Watch for volume trends and RSI for signs of overextension.
Analysis
The stock has experienced significant fluctuations, with a recent bullish trend. Key resistance at 2550.0 and support at 2400.0. Technical indicators show mixed signals, with potential for both upward and downward movements.
Confidence Level
Potential Risks
Market volatility and external economic factors could significantly impact price movements.
3 Months Prediction
Target: September 21, 2025$2300
$2350
$2400
$2200
Description
Expecting a decline to 2300.0 as market sentiment may shift bearish due to potential economic headwinds. Watch for support at 2200.0, which could be tested.
Analysis
The stock's performance shows a potential reversal trend. Key support at 2200.0 and resistance at 2400.0. Technical indicators suggest weakening momentum, with MACD showing bearish divergence. Market sentiment may shift due to external factors.
Confidence Level
Potential Risks
Economic downturns or negative news could lead to sharper declines than anticipated.