ETH-USD Trading Predictions
1 Day Prediction
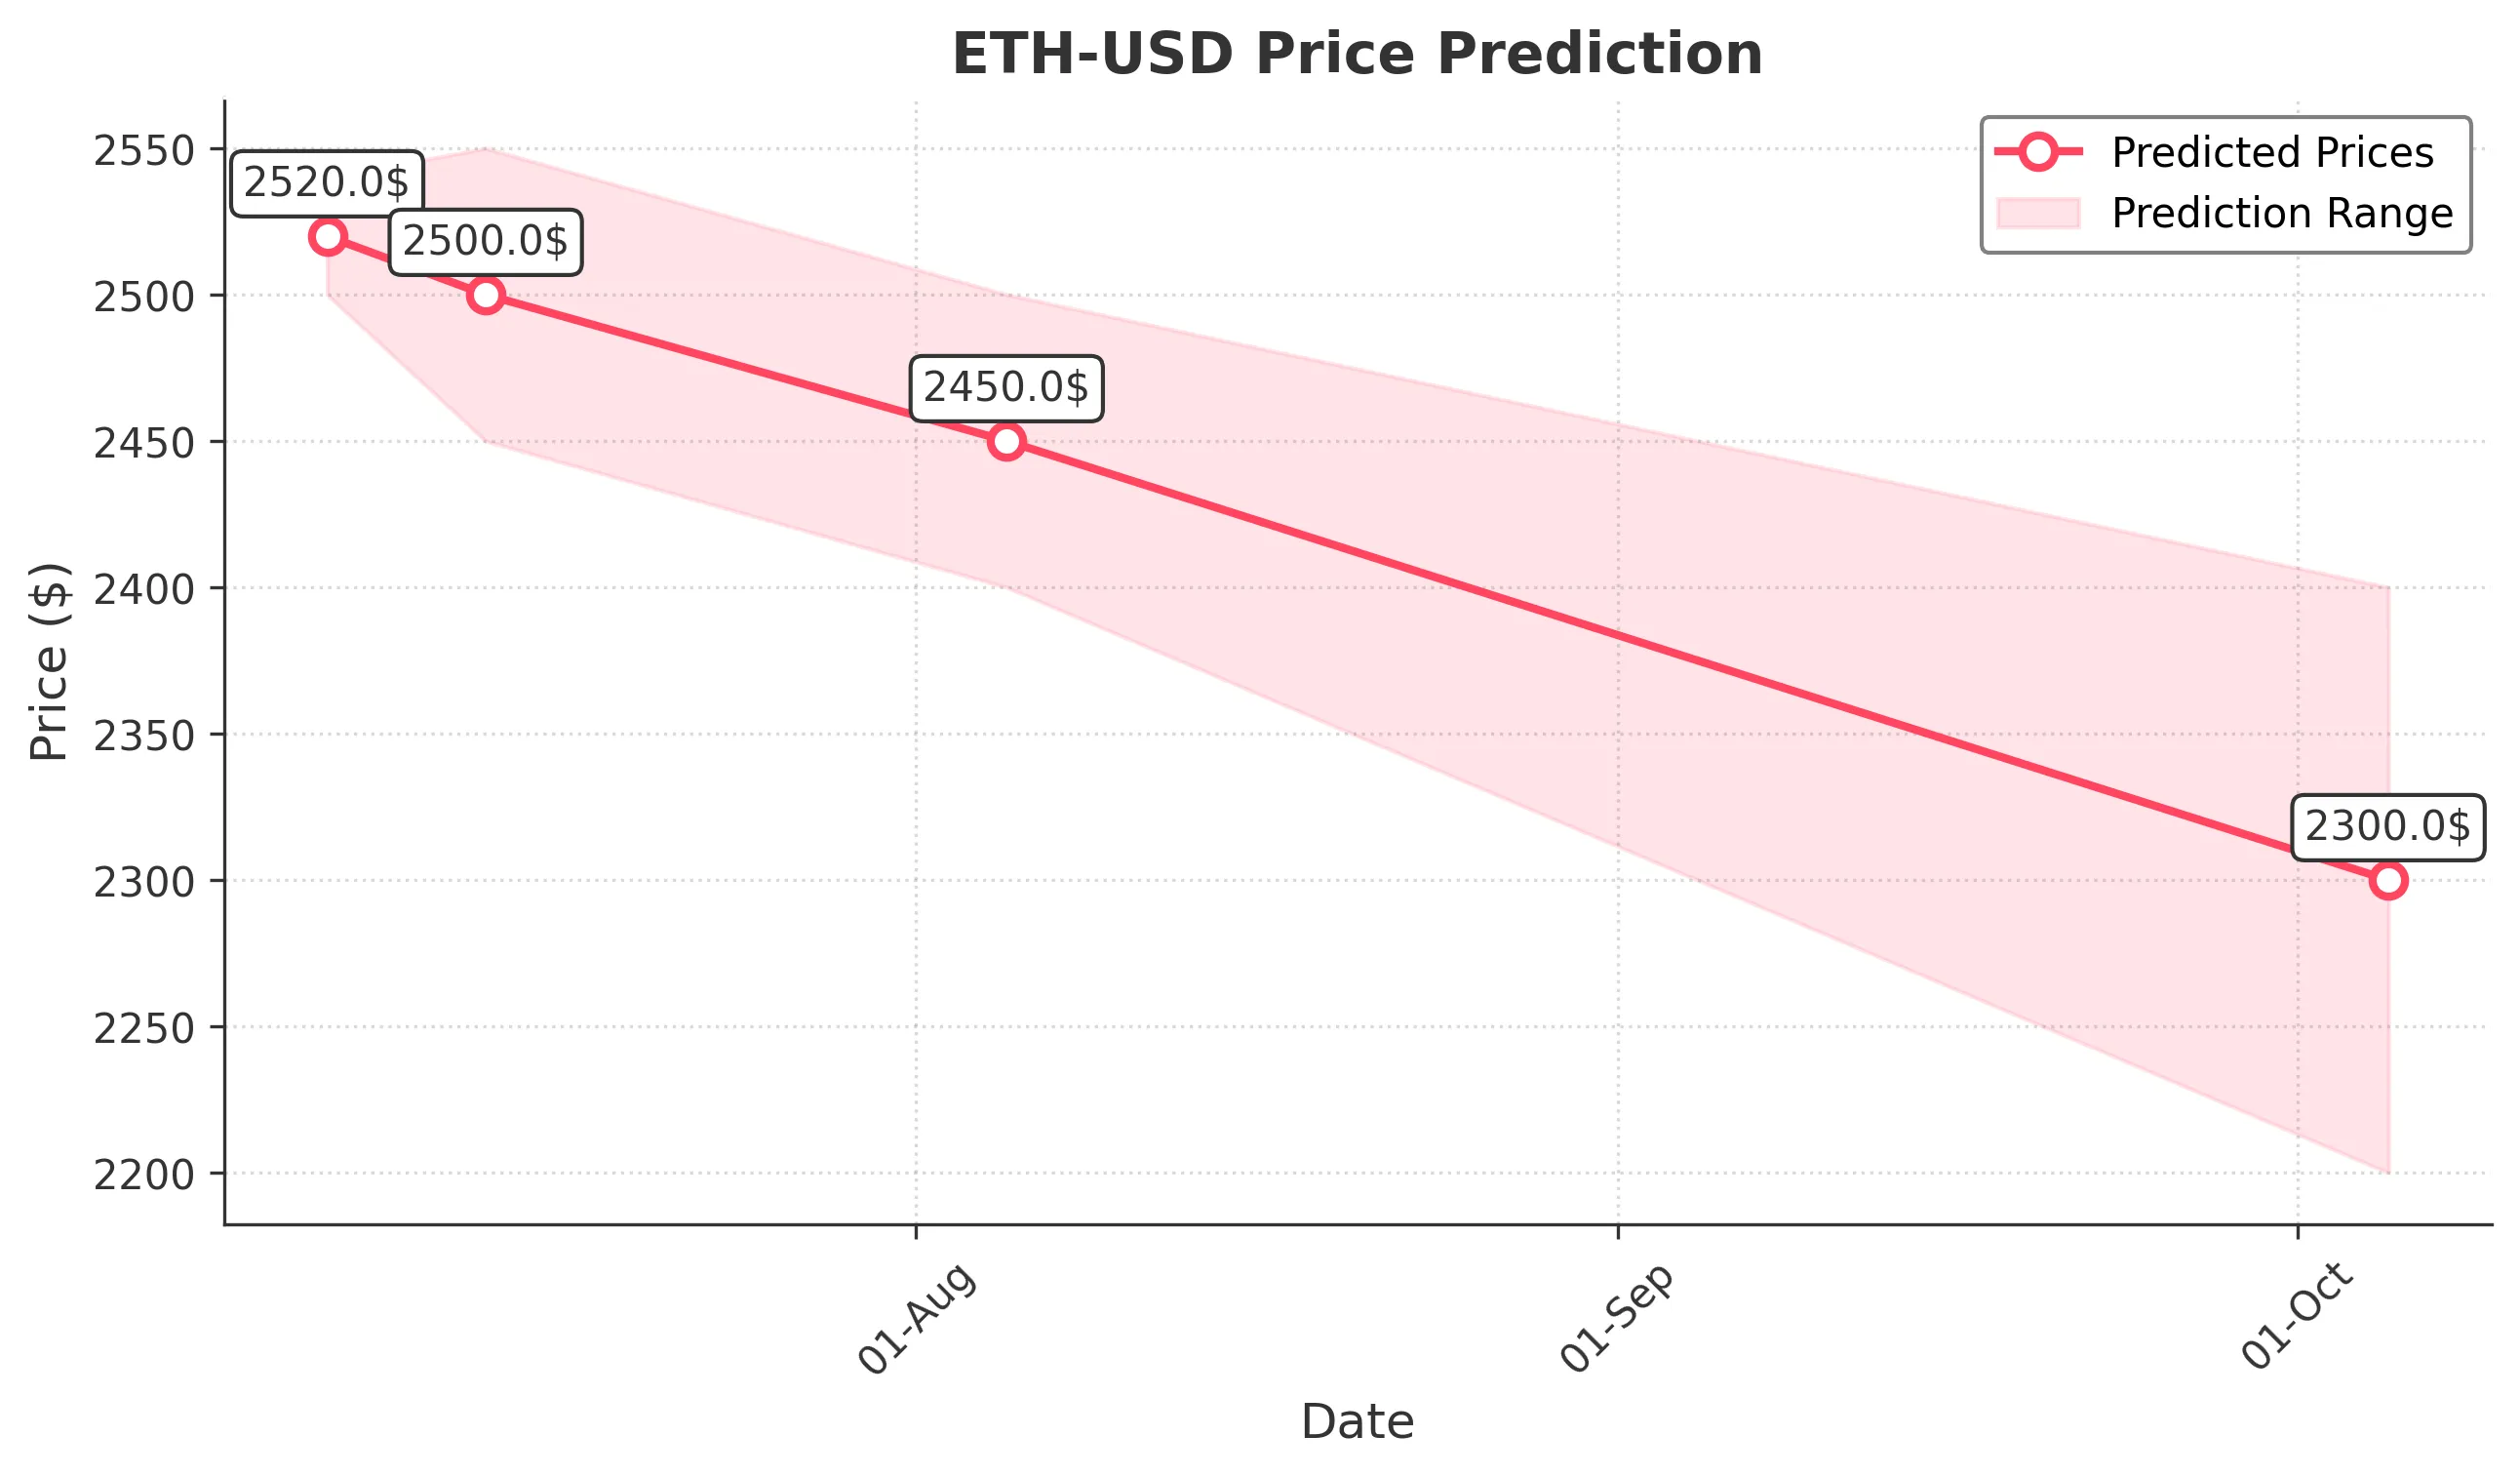
Target: July 6, 2025$2520
$2525
$2540
$2500
Description
The price is expected to stabilize around 2520.0, supported by recent bullish momentum. However, the RSI indicates overbought conditions, suggesting potential pullbacks. Volume remains high, indicating strong interest.
Analysis
The past 3 months show a bullish trend with significant price fluctuations. Key resistance at 2600.0 and support around 2400.0. The MACD is bullish, but the RSI indicates overbought conditions. Volume spikes suggest strong trading interest.
Confidence Level
Potential Risks
Potential for a reversal exists due to overbought RSI and recent volatility. Market sentiment may shift quickly.
1 Week Prediction
Target: July 13, 2025$2500
$2520
$2550
$2450
Description
Expect a slight decline to 2500.0 as profit-taking may occur after recent highs. The MACD shows signs of weakening momentum, and the RSI is approaching overbought territory.
Analysis
The stock has shown volatility with a recent bullish trend. Resistance at 2600.0 remains strong, while support is at 2400.0. The ATR indicates increasing volatility, and volume patterns suggest active trading.
Confidence Level
Potential Risks
Market sentiment could shift rapidly, and external factors may influence price movements. Watch for news that could impact trading.
1 Month Prediction
Target: August 5, 2025$2450
$2500
$2500
$2400
Description
A gradual decline to 2450.0 is anticipated as market corrections take place. The RSI indicates potential bearish divergence, and the MACD may cross below the signal line.
Analysis
The stock has been volatile, with a recent bullish trend. Key resistance at 2600.0 and support at 2400.0. The MACD is showing signs of weakening momentum, and the RSI indicates potential overbought conditions.
Confidence Level
Potential Risks
Uncertainty exists due to potential market corrections and external economic factors. Watch for macroeconomic news that could impact sentiment.
3 Months Prediction
Target: October 5, 2025$2300
$2450
$2400
$2200
Description
A bearish trend is expected, with a decline to 2300.0 as market corrections and profit-taking continue. The MACD is bearish, and the RSI indicates oversold conditions.
Analysis
The stock has shown a bearish trend with significant fluctuations. Resistance at 2600.0 and support at 2200.0. The ATR indicates high volatility, and the MACD is bearish, suggesting potential further declines.
Confidence Level
Potential Risks
Market volatility and external economic events could significantly impact predictions. Watch for changes in market sentiment.