ETH-USD Trading Predictions
1 Day Prediction
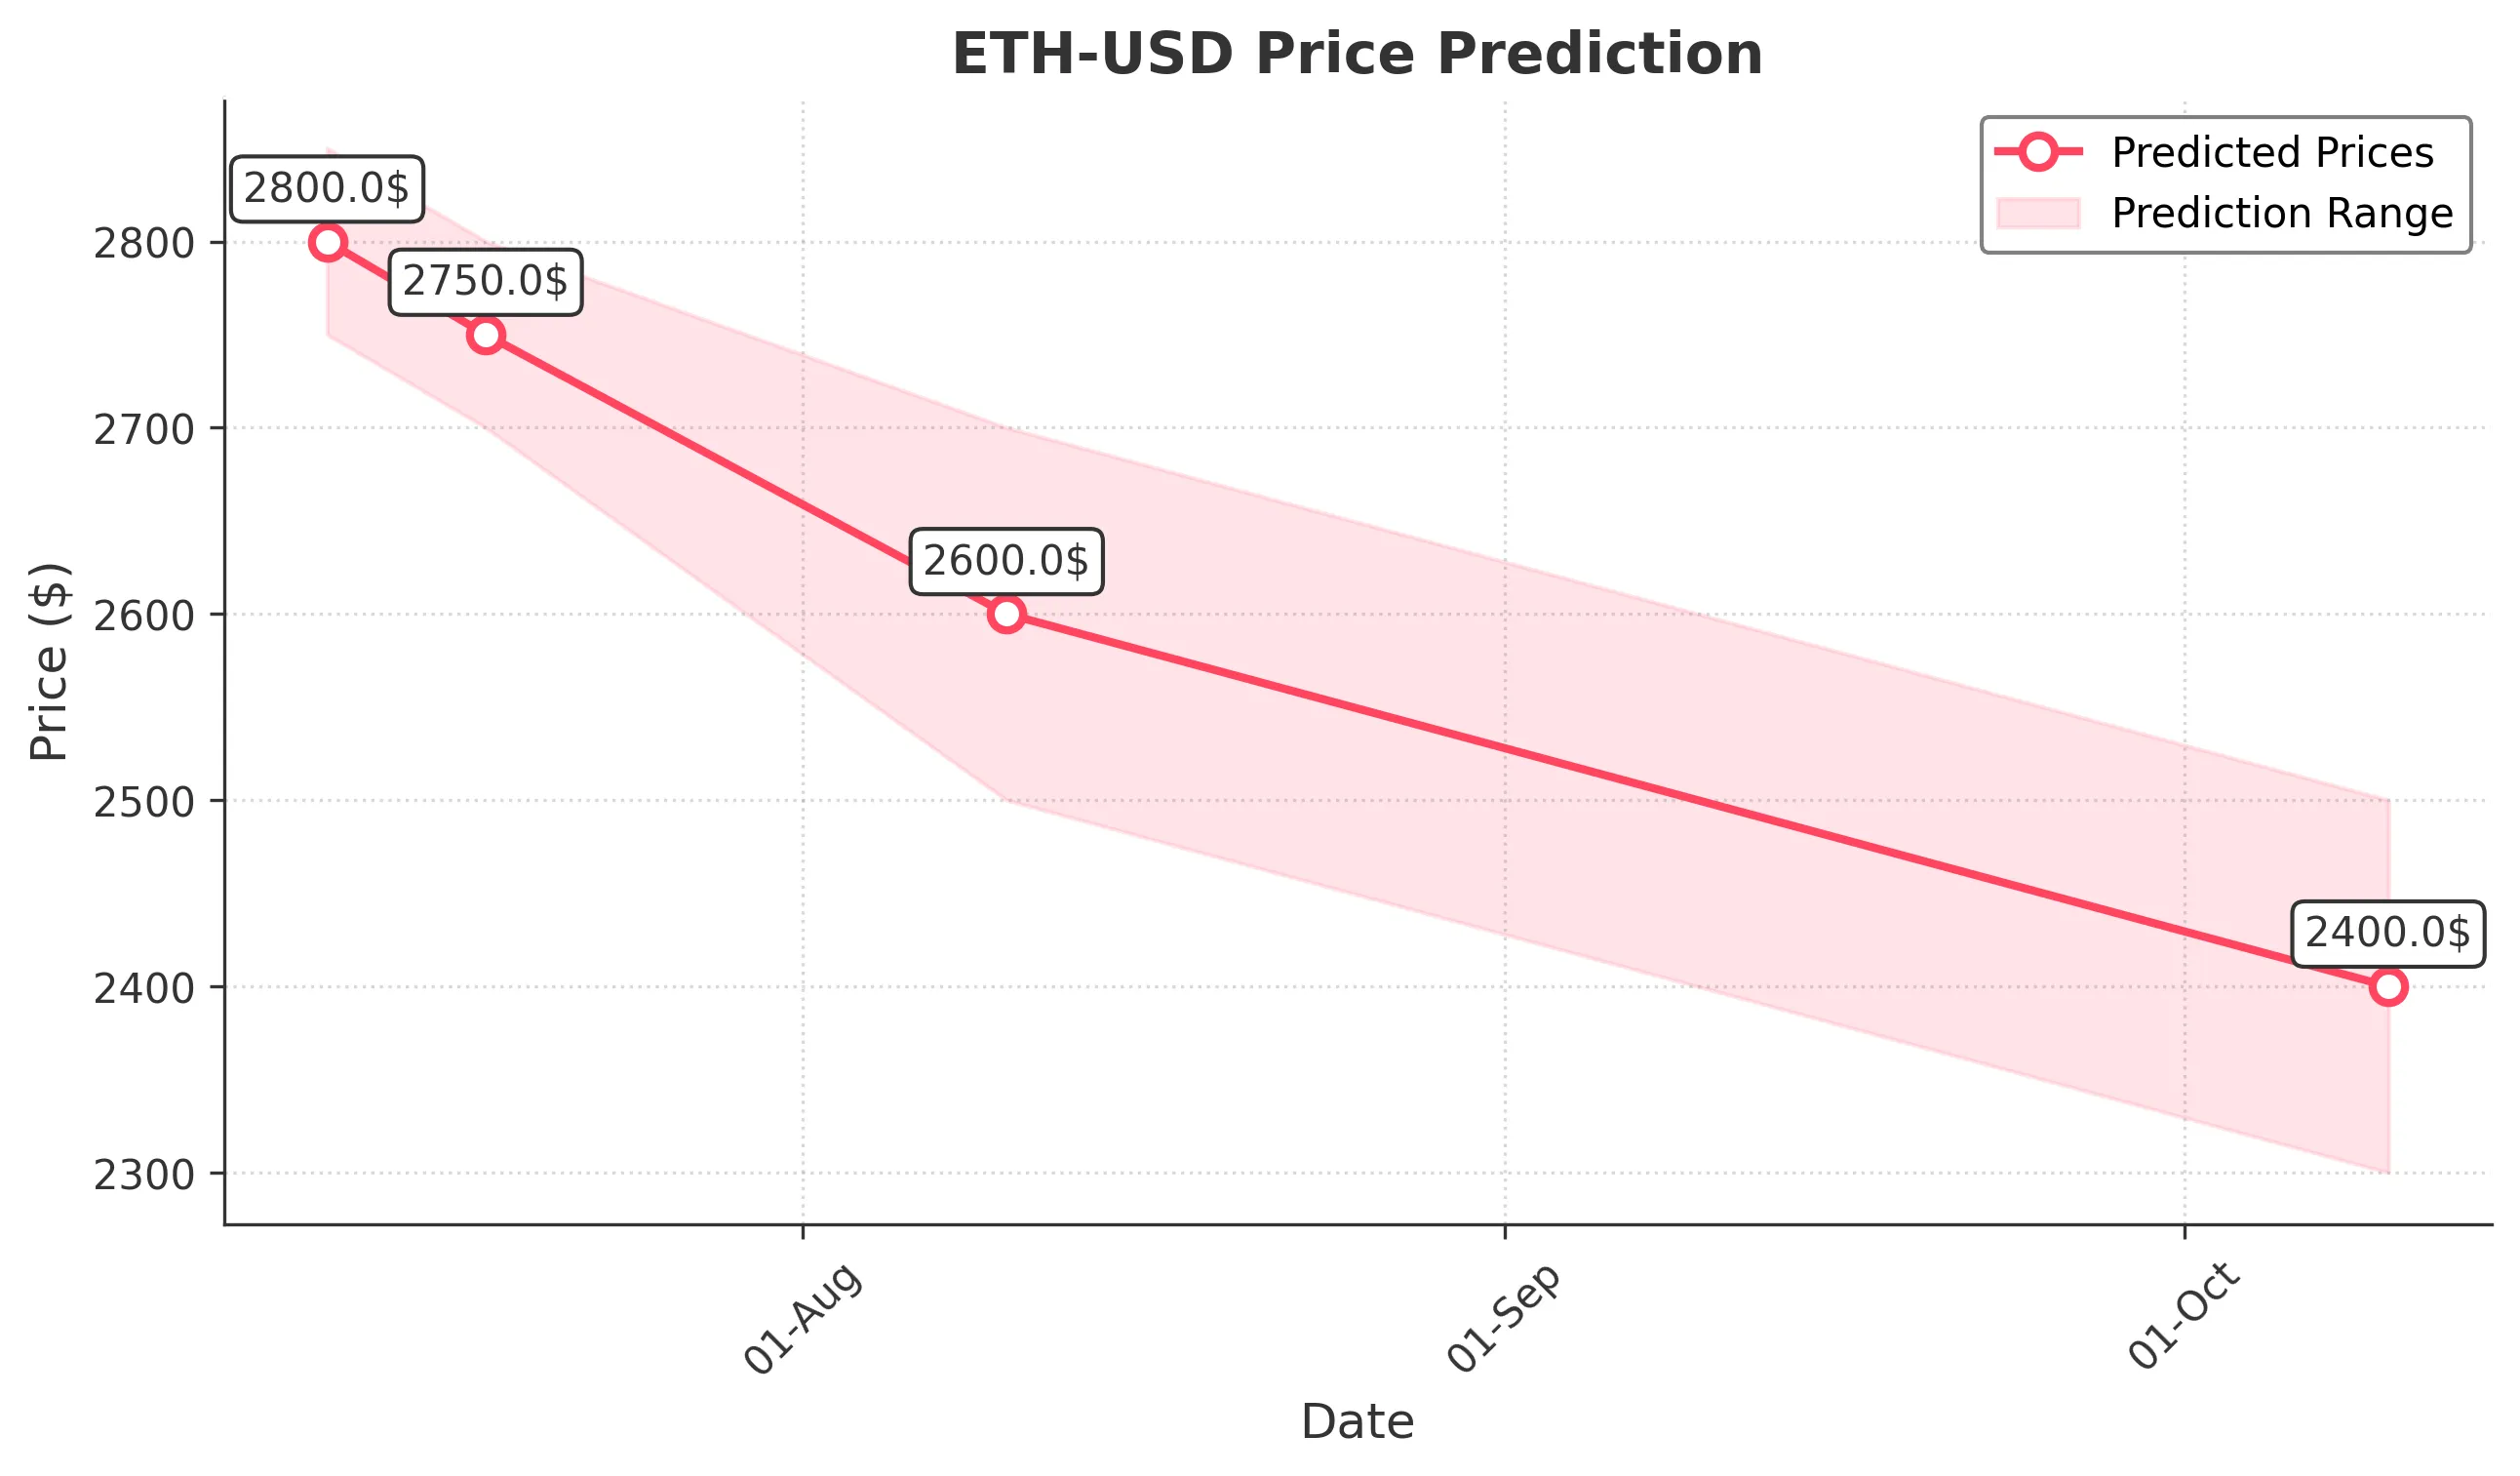
Target: July 11, 2025$2800
$2790
$2850
$2750
Description
The recent bullish momentum, indicated by higher highs and higher lows, suggests a continuation. The RSI is approaching overbought levels, but MACD remains positive. Volume spikes on recent days support the upward trend.
Analysis
The past 3 months show a bullish trend with significant price increases. Key resistance at $2800. The MACD is bullish, and RSI indicates overbought conditions. Volume has been strong, indicating strong buying interest.
Confidence Level
Potential Risks
Potential profit-taking could lead to a pullback. Market sentiment may shift due to external factors.
1 Week Prediction
Target: July 18, 2025$2750
$2780
$2800
$2700
Description
A slight pullback is expected as the market consolidates after recent highs. The RSI indicates overbought conditions, and profit-taking may occur. However, support at $2700 should hold.
Analysis
The stock has shown strong bullish momentum, but recent overbought signals suggest a potential correction. Key support at $2700 and resistance at $2800. Volume remains high, indicating continued interest.
Confidence Level
Potential Risks
Market volatility and external news could impact price direction. A break below $2700 could signal further declines.
1 Month Prediction
Target: August 10, 2025$2600
$2750
$2700
$2500
Description
Expect a gradual decline as the market corrects from recent highs. The RSI is likely to normalize, and MACD may turn bearish. Support at $2500 is critical.
Analysis
The stock has experienced significant volatility with a recent peak. The overall trend remains bullish, but signs of exhaustion are evident. Key support at $2500 and resistance at $2700. Volume patterns suggest potential selling pressure.
Confidence Level
Potential Risks
Unforeseen macroeconomic events could alter market sentiment. A strong bullish reversal could occur if support holds.
3 Months Prediction
Target: October 10, 2025$2400
$2450
$2500
$2300
Description
A bearish trend is anticipated as the market adjusts to previous highs. Continued selling pressure may push prices lower, with key support at $2300.
Analysis
The stock has shown a strong upward trend but is now facing potential resistance. The overall sentiment is mixed, with bearish signals emerging. Key support at $2300 and resistance at $2500. Volume has decreased, indicating waning interest.
Confidence Level
Potential Risks
Market sentiment could shift positively if new bullish catalysts emerge. Economic indicators may also influence price direction.