ETH-USD Trading Predictions
1 Day Prediction
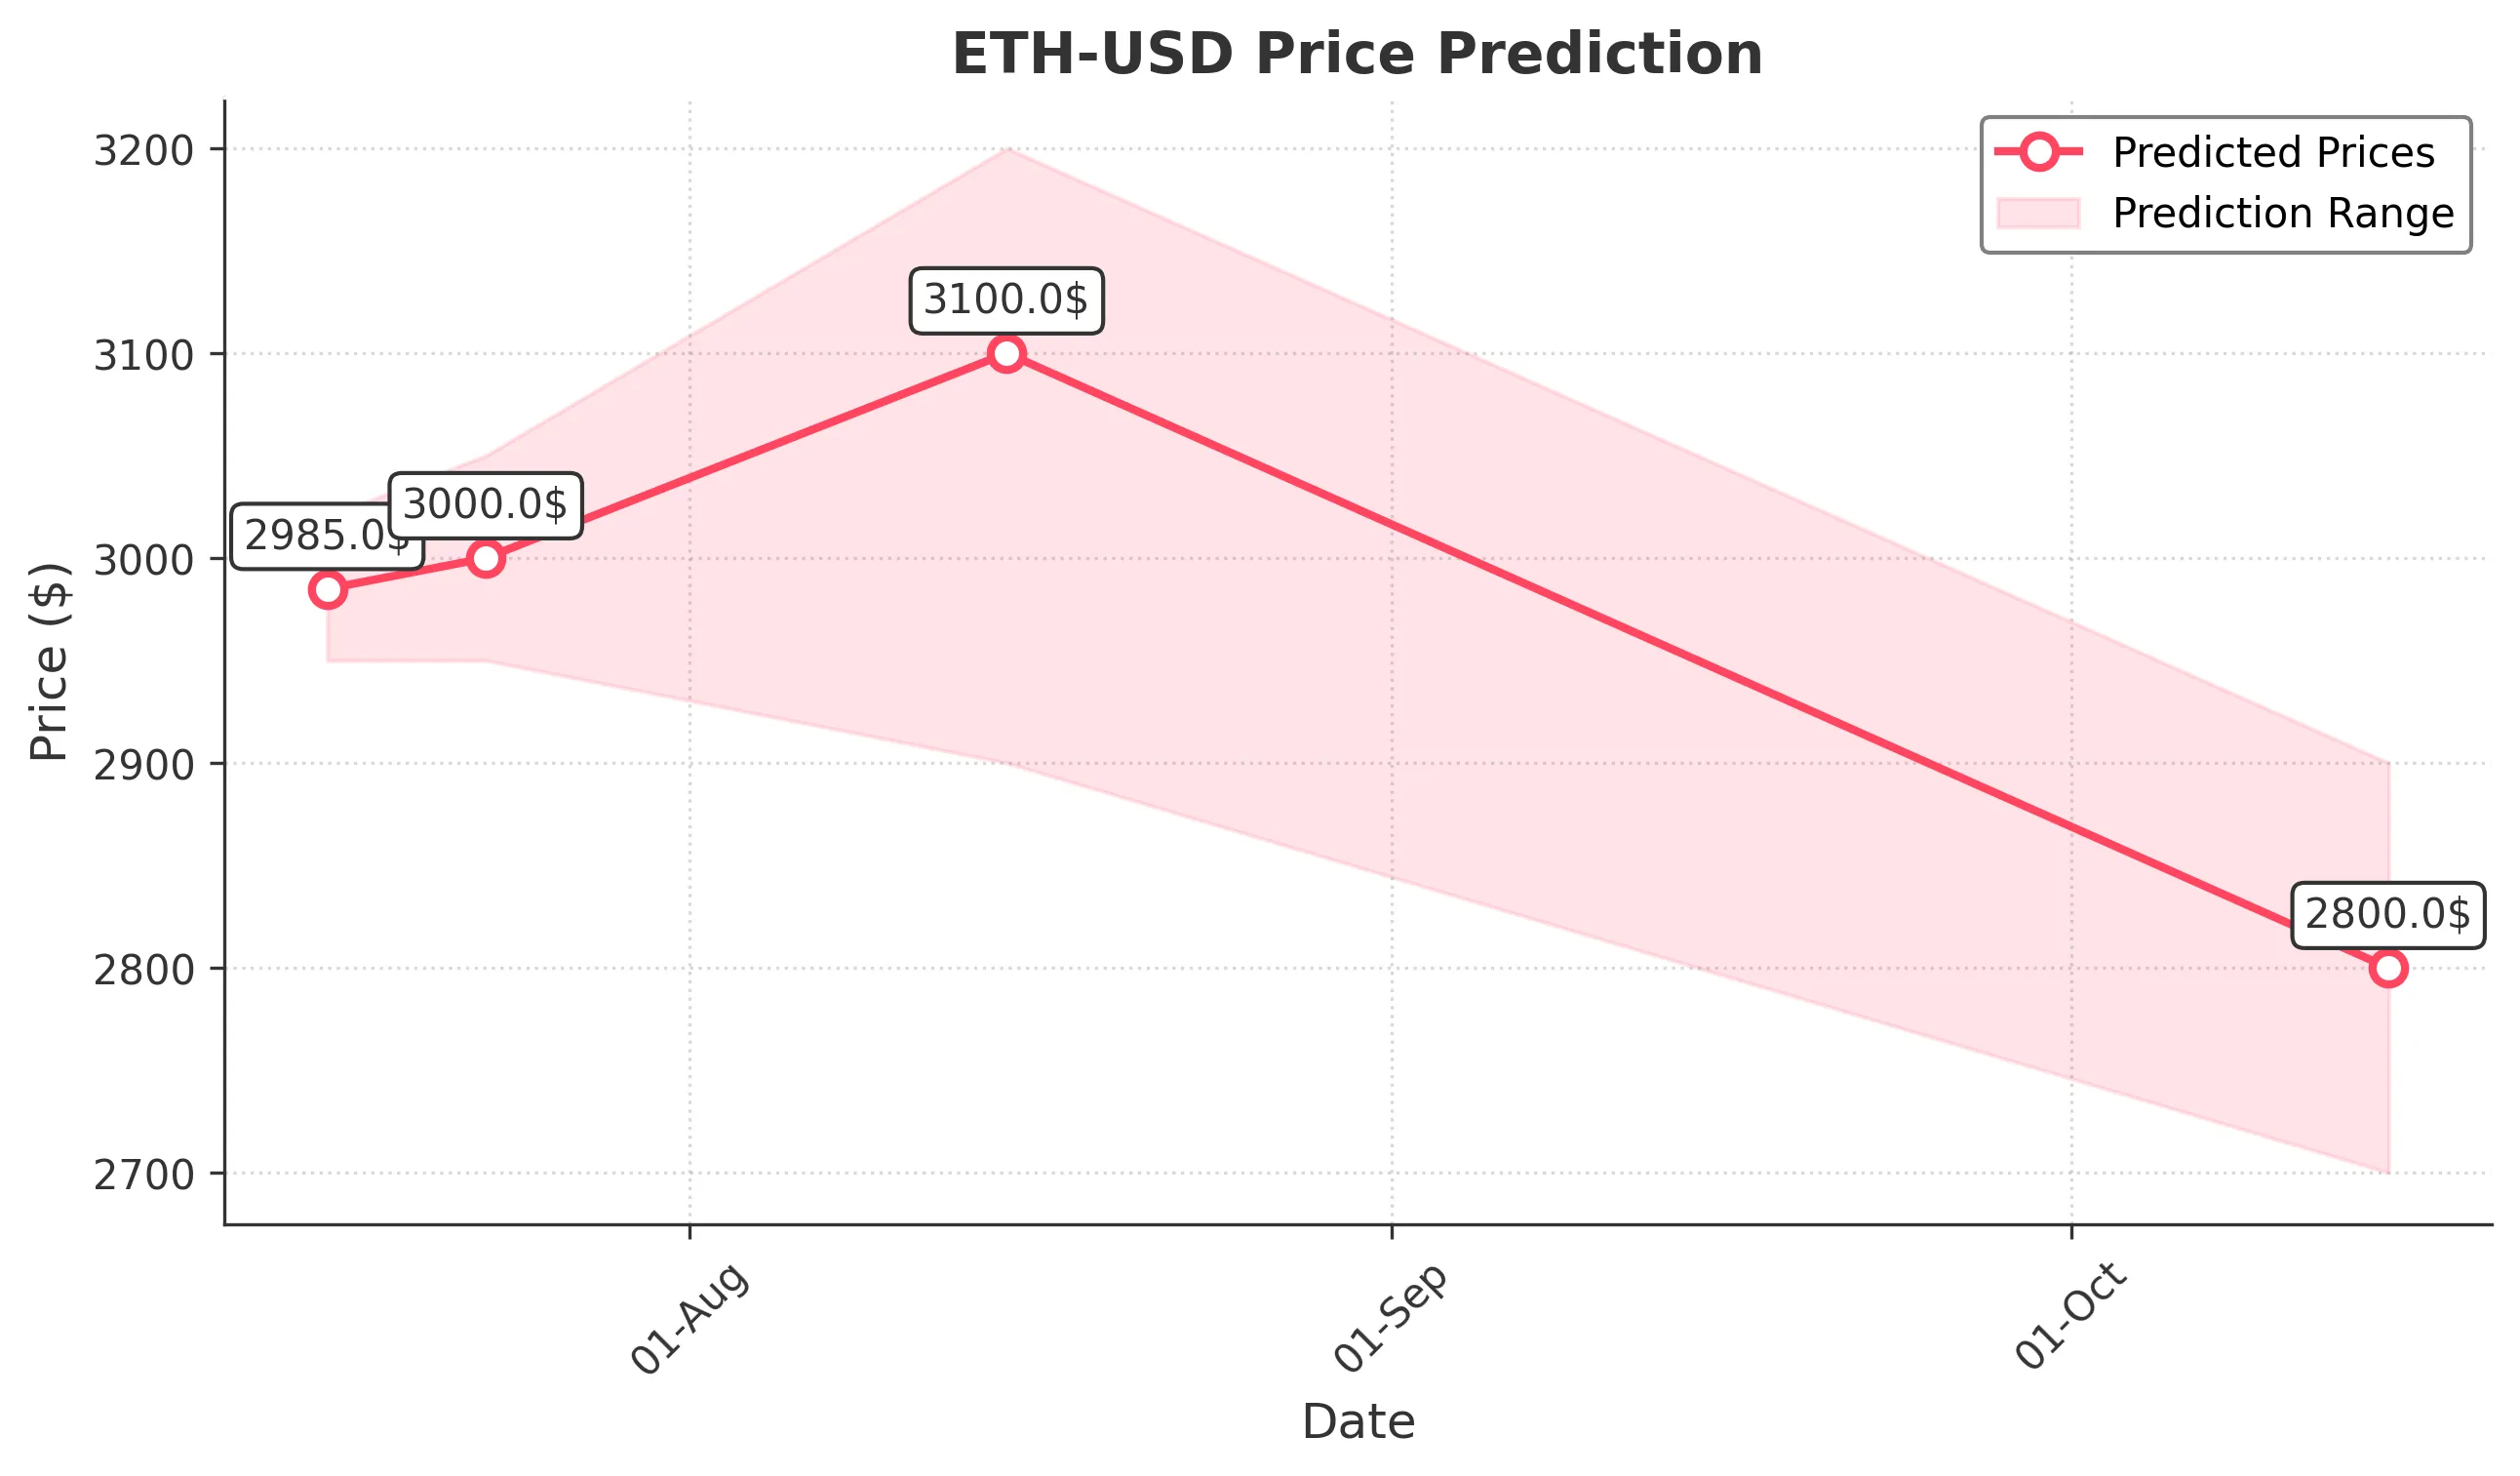
Target: July 16, 2025$2985
$2980
$3020
$2950
Description
The price is expected to remain strong due to bullish momentum from recent highs. The MACD shows a bullish crossover, and RSI is near 60, indicating strength. However, volatility remains high, which could lead to fluctuations.
Analysis
Over the past 3 months, ETH-USD has shown a bullish trend, with significant upward movements. Key support is around $2900, while resistance is near $3100. Volume spikes indicate strong buying interest, but recent volatility suggests caution.
Confidence Level
Potential Risks
Potential profit-taking could lead to a pullback, and external market factors may influence volatility.
1 Week Prediction
Target: July 23, 2025$3000
$2985
$3050
$2950
Description
The bullish trend is expected to continue, supported by strong volume and positive market sentiment. However, the RSI nearing overbought levels may indicate a potential correction.
Analysis
ETH-USD has been on a strong upward trajectory, with significant resistance at $3100. The recent bullish candlestick patterns suggest continued buying pressure, but the market remains sensitive to external factors.
Confidence Level
Potential Risks
Market corrections or negative news could impact the price, leading to increased volatility.
1 Month Prediction
Target: August 15, 2025$3100
$3000
$3200
$2900
Description
The price is projected to rise as bullish sentiment persists. Fibonacci retracement levels indicate potential resistance at $3200, while support remains at $2900. Watch for any bearish divergence in RSI.
Analysis
The past three months show a strong bullish trend, with significant volume supporting price increases. Key resistance levels are being tested, and any negative sentiment could trigger a pullback.
Confidence Level
Potential Risks
Market corrections or adverse news could lead to a decline, especially if the RSI indicates overbought conditions.
3 Months Prediction
Target: October 15, 2025$2800
$2900
$2900
$2700
Description
A potential correction is anticipated as the market may overheat. The MACD shows signs of divergence, and RSI may indicate overbought conditions. Watch for support at $2700.
Analysis
The overall trend has been bullish, but signs of exhaustion are emerging. Key support at $2700 and resistance at $3100 will be critical in determining future price movements. Market sentiment remains mixed.
Confidence Level
Potential Risks
Unforeseen macroeconomic events or regulatory news could significantly impact the price, leading to increased volatility.