GBPUSDX Trading Predictions
1 Day Prediction
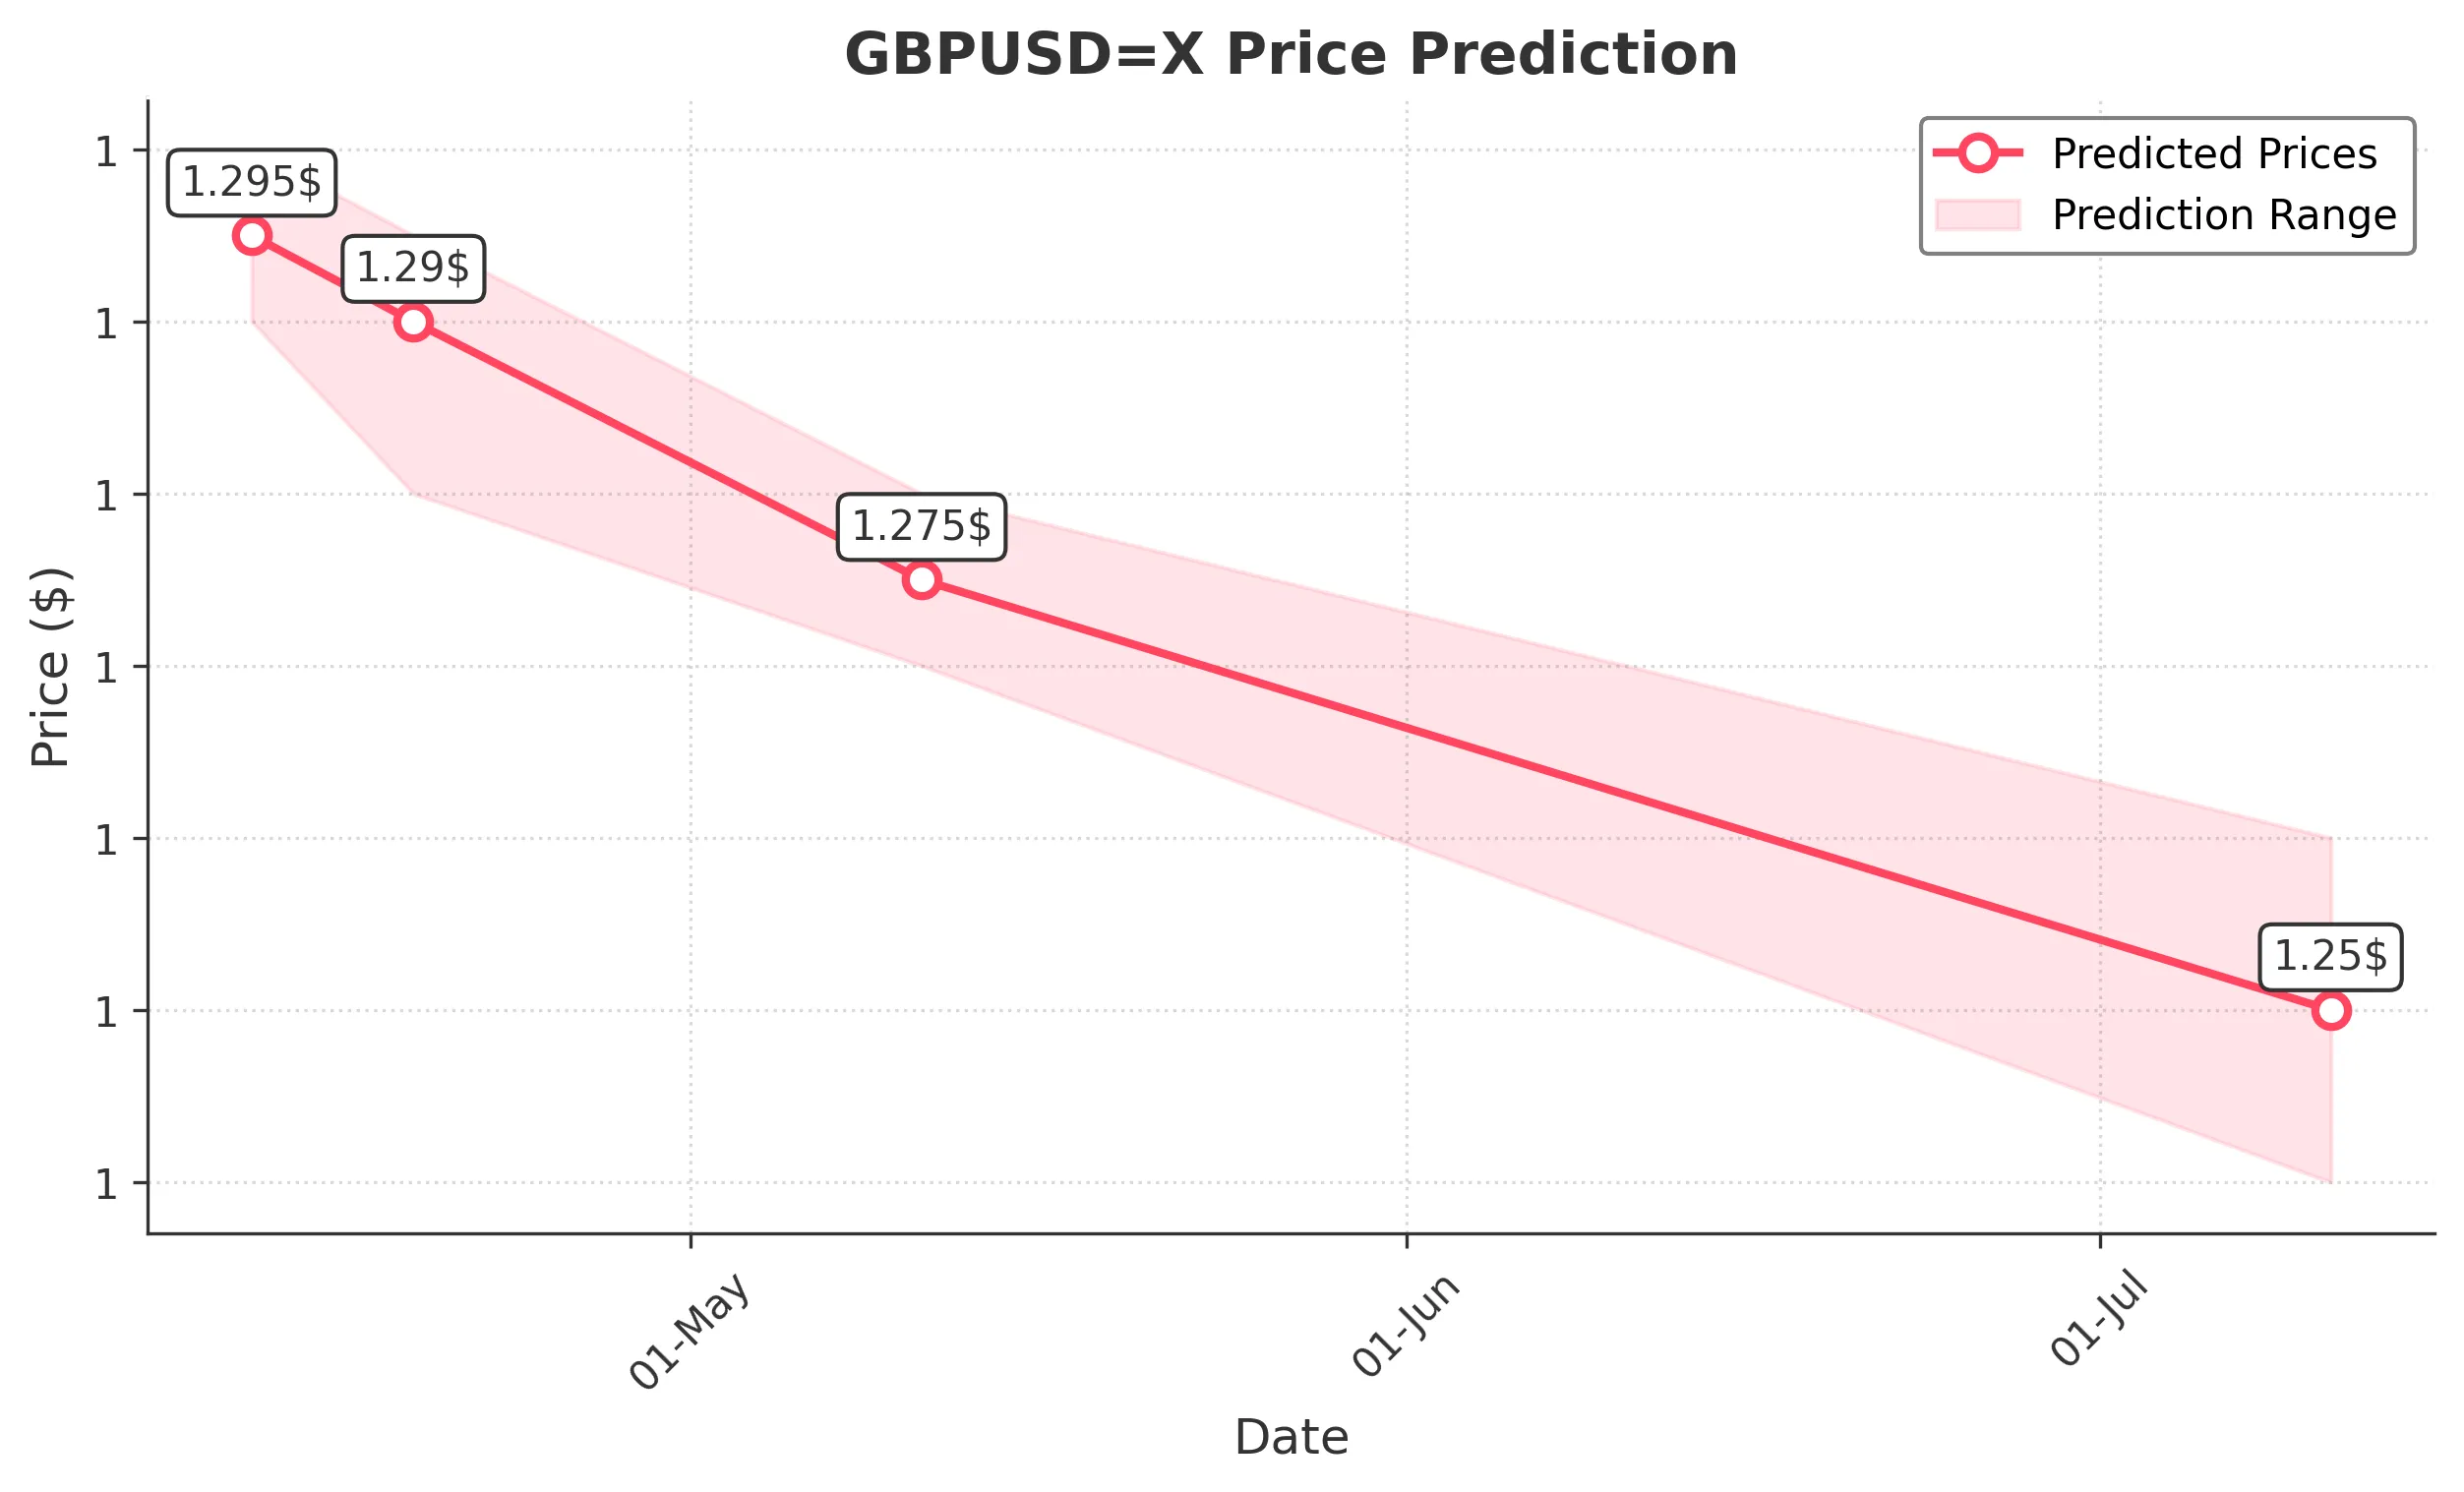
Target: April 12, 2025$1.295
$1.295
$1.3
$1.29
Description
The recent bullish momentum suggests a potential continuation, with the price stabilizing around 1.295. The RSI indicates overbought conditions, which may limit upside. Watch for resistance at 1.300.
Analysis
The past 3 months show a bullish trend with significant volatility. Key resistance at 1.300 and support around 1.290. Recent candlestick patterns indicate indecision, and volume has been low, suggesting caution.
Confidence Level
Potential Risks
Potential reversal due to overbought RSI and market sentiment shifts.
1 Week Prediction
Target: April 19, 2025$1.29
$1.295
$1.295
$1.28
Description
Expect a slight pullback as the market consolidates. The MACD shows bearish divergence, indicating potential weakness. Watch for support at 1.280.
Analysis
The stock has shown a bullish trend but is facing resistance. The MACD and RSI suggest a potential pullback. Volume patterns indicate lower interest, which could lead to price declines.
Confidence Level
Potential Risks
Market volatility and external economic news could impact this prediction.
1 Month Prediction
Target: May 11, 2025$1.275
$1.28
$1.28
$1.27
Description
A bearish trend is anticipated as the market reacts to macroeconomic factors. The Fibonacci retracement levels suggest a target around 1.275, with potential support at 1.270.
Analysis
The overall trend is bearish with significant resistance at 1.280. The RSI indicates potential oversold conditions, but macroeconomic factors may drive prices lower. Volume has been decreasing, indicating waning interest.
Confidence Level
Potential Risks
Unforeseen economic data releases could alter market sentiment significantly.
3 Months Prediction
Target: July 11, 2025$1.25
$1.255
$1.26
$1.24
Description
Long-term bearish sentiment is expected as economic conditions worsen. The price may test lower support levels around 1.250, with potential for further declines.
Analysis
The stock has been in a bearish trend with key support at 1.250. Technical indicators suggest further declines, but external economic factors could influence the market. Volume patterns indicate a lack of strong buying interest.
Confidence Level
Potential Risks
Market conditions are highly volatile, and unexpected news could lead to significant price swings.