GBPUSDX Trading Predictions
1 Day Prediction
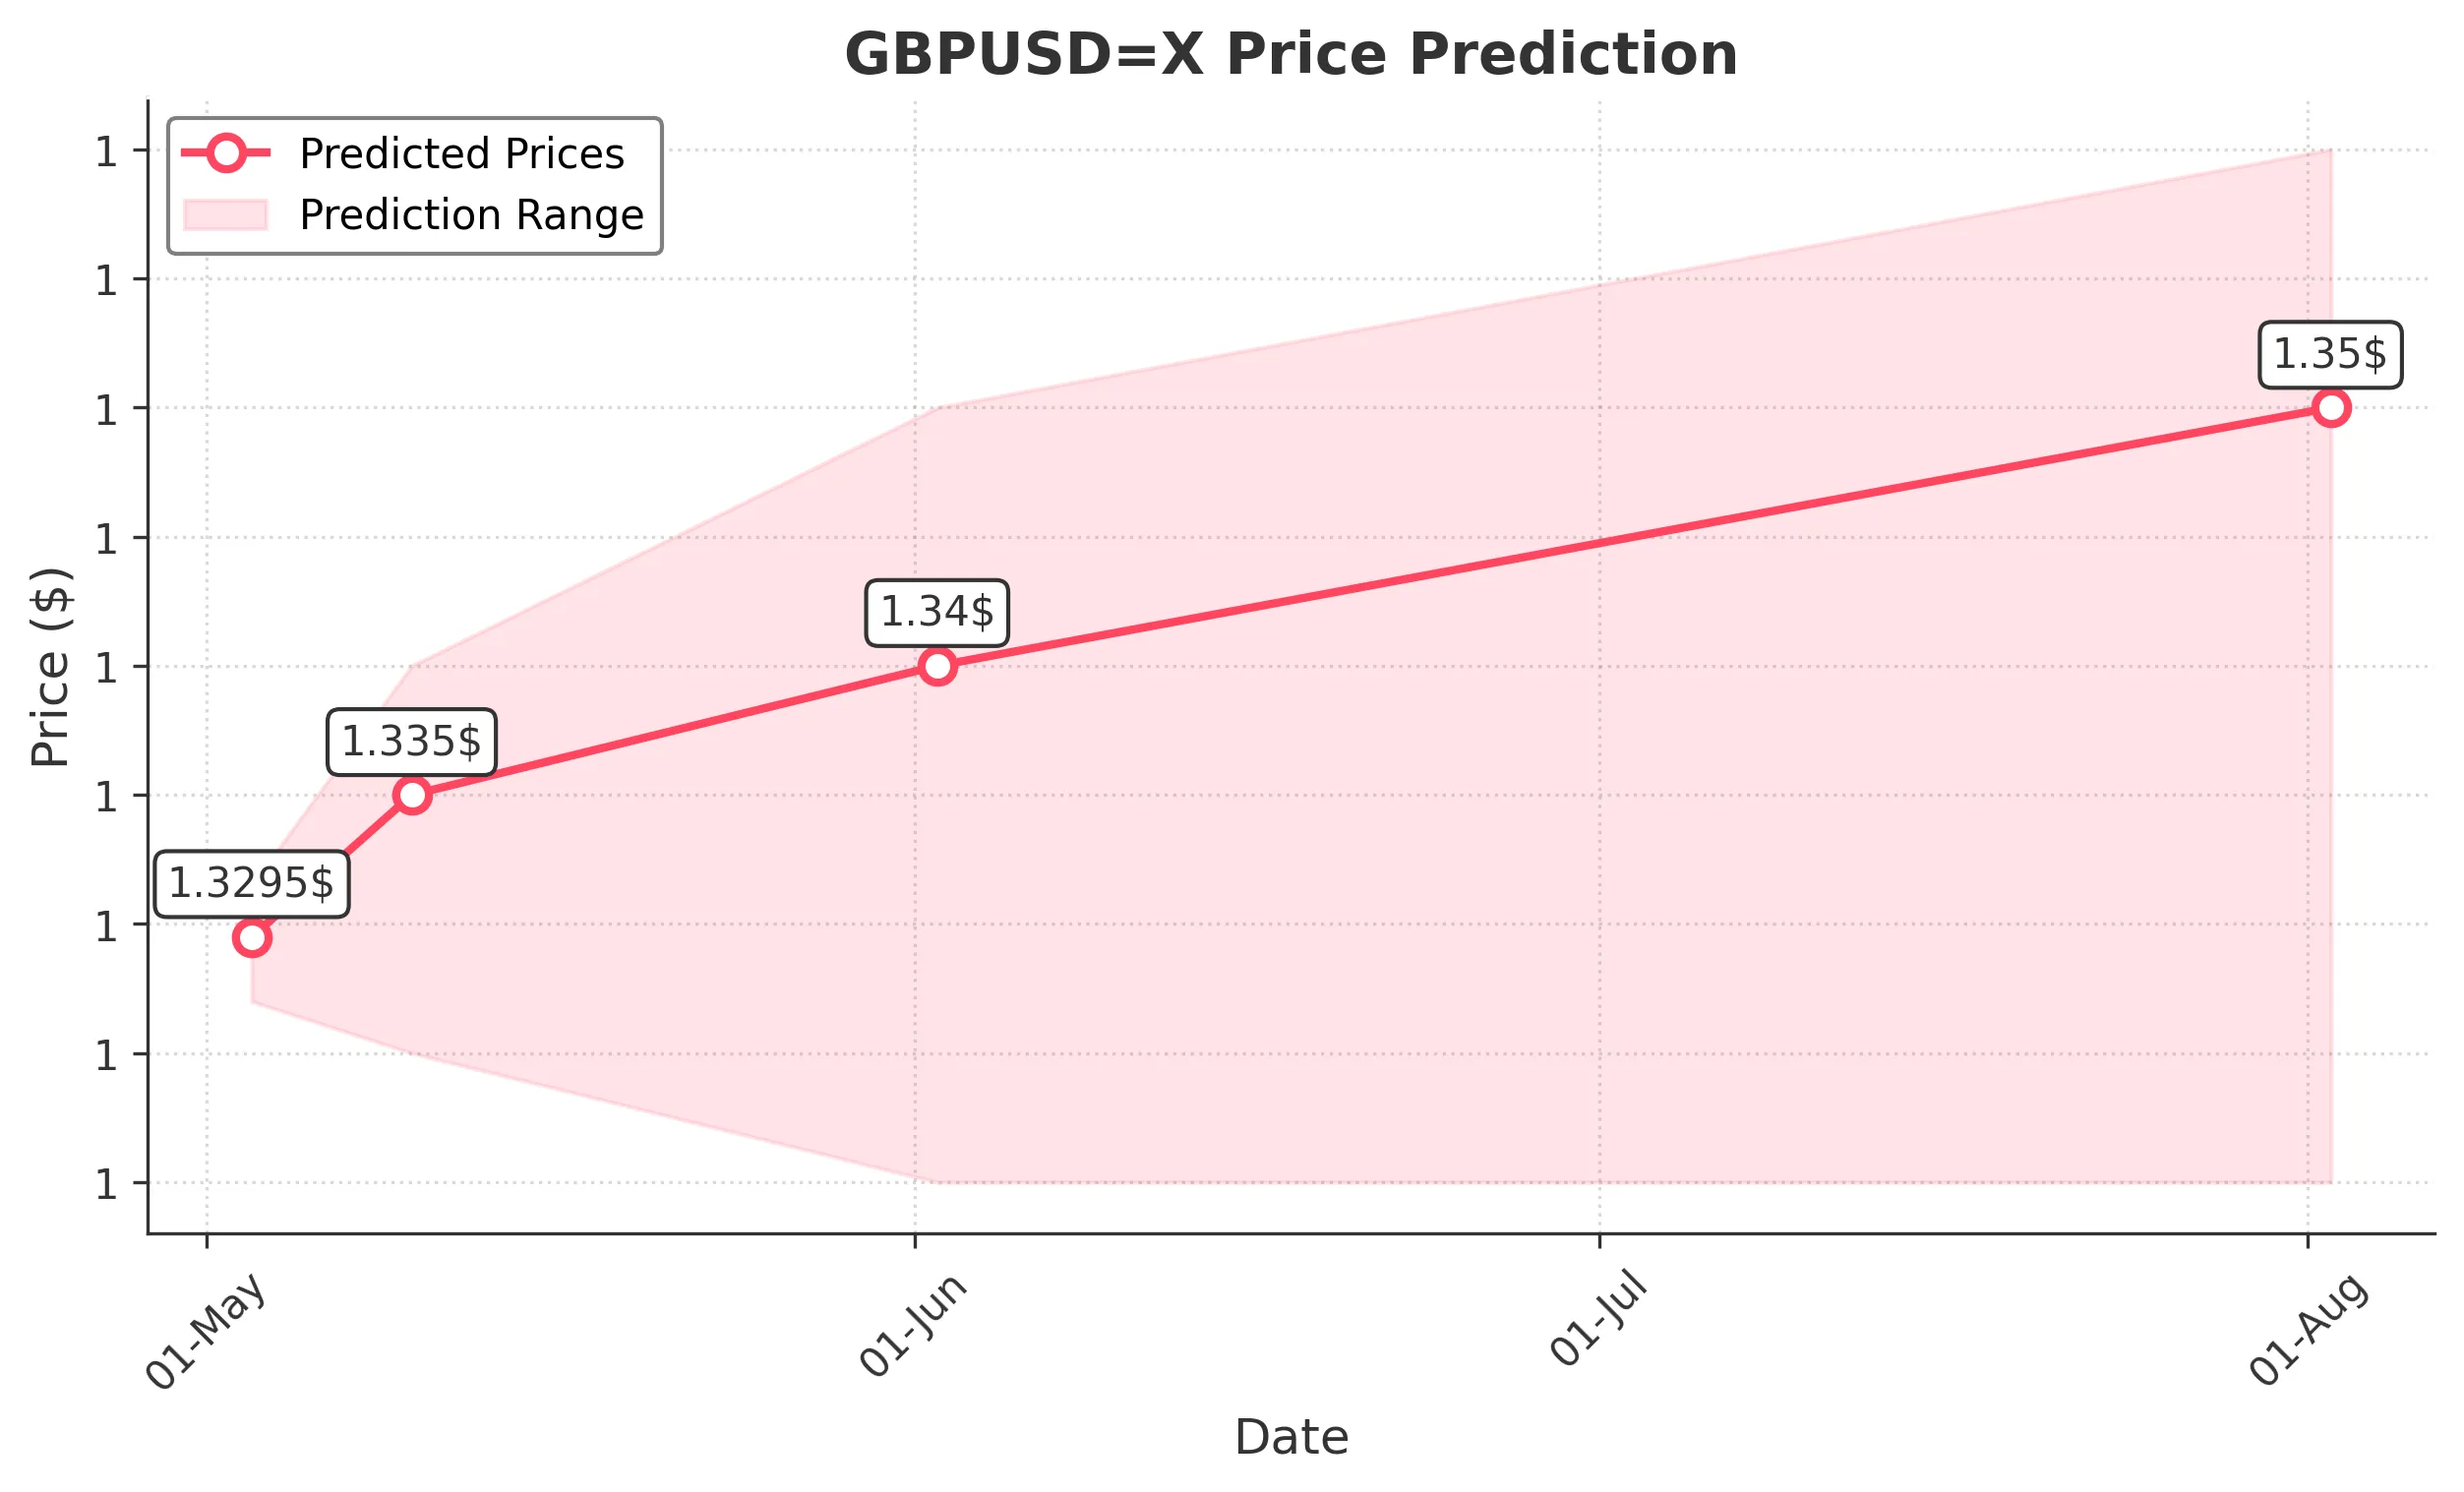
Target: May 3, 2025$1.3295
$1.3285
$1.3315
$1.327
Description
The recent bullish trend is supported by a rising MACD and RSI above 50, indicating momentum. A Doji pattern suggests indecision, but overall sentiment remains positive. Expect slight fluctuations within the established range.
Analysis
Over the past 3 months, GBPUSD has shown a bullish trend with significant support at 1.3200 and resistance around 1.3400. The RSI indicates overbought conditions, while volume has been stable. Recent candlestick patterns suggest a possible pullback.
Confidence Level
Potential Risks
Potential volatility due to macroeconomic news could impact the prediction.
1 Week Prediction
Target: May 10, 2025$1.335
$1.33
$1.34
$1.325
Description
The bullish momentum is expected to continue, supported by a strong MACD crossover. However, the RSI nearing overbought levels may lead to a correction. Anticipate a test of resistance at 1.3400.
Analysis
The stock has been trending upward, with key support at 1.3200. The MACD indicates bullish momentum, but the RSI suggests caution. Volume patterns show stability, but any significant news could alter the trajectory.
Confidence Level
Potential Risks
Market sentiment could shift due to geopolitical events or economic data releases.
1 Month Prediction
Target: June 2, 2025$1.34
$1.335
$1.35
$1.32
Description
Expect continued bullish momentum as the price approaches the Fibonacci retracement level at 1.3400. The MACD remains positive, but the RSI indicates potential overbought conditions, suggesting a possible pullback.
Analysis
The past three months show a strong upward trend with resistance at 1.3500. The RSI is approaching overbought territory, and volume has been consistent. A correction could occur if market sentiment shifts.
Confidence Level
Potential Risks
Economic indicators and central bank decisions could lead to unexpected volatility.
3 Months Prediction
Target: August 2, 2025$1.35
$1.34
$1.36
$1.32
Description
The bullish trend may continue, but the market could face resistance at 1.3500. The MACD indicates a potential slowdown, and the RSI suggests caution. Watch for external economic factors that could impact the trend.
Analysis
The overall trend has been bullish, with key support at 1.3200 and resistance at 1.3500. The MACD shows signs of potential weakening momentum, and the RSI indicates overbought conditions. Volume patterns remain stable, but external factors could influence future performance.
Confidence Level
Potential Risks
Unforeseen economic events or shifts in market sentiment could lead to significant price changes.