GBPUSDX Trading Predictions
1 Day Prediction
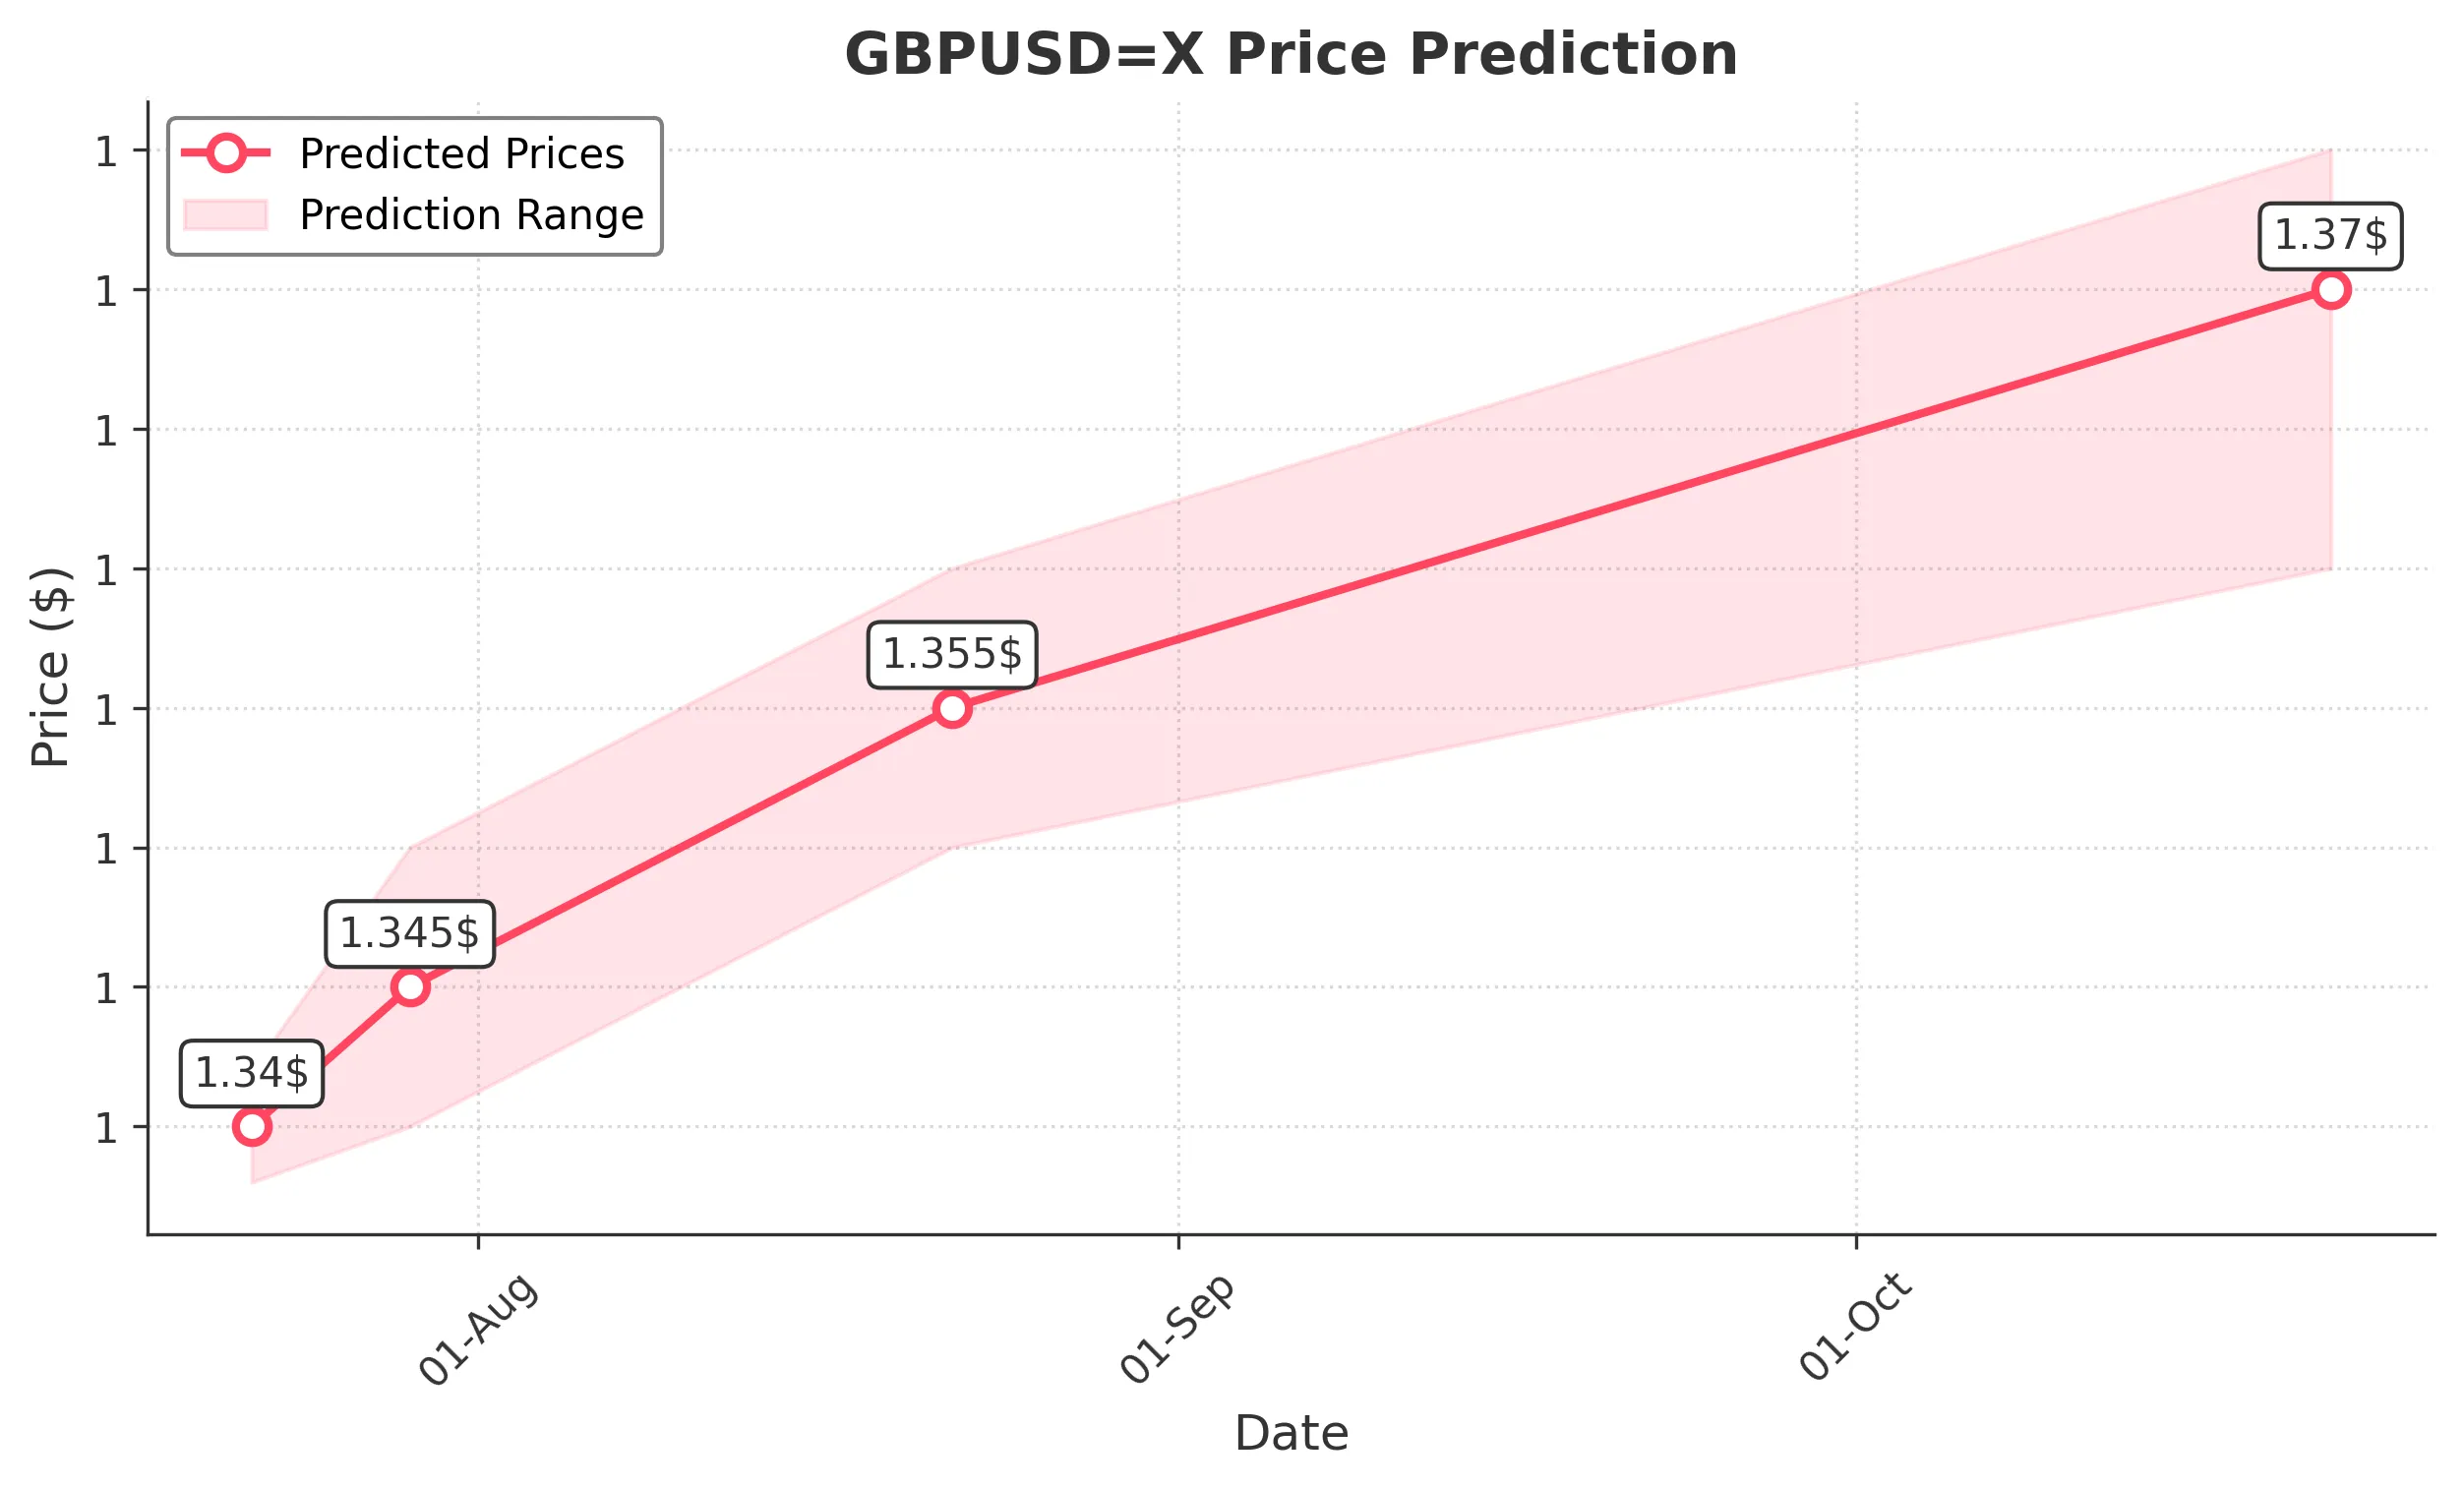
Target: July 22, 2025$1.34
$1.34
$1.342
$1.338
Description
The market shows a slight bullish trend with a recent Doji pattern indicating indecision. The RSI is neutral, suggesting potential for upward movement. However, MACD is flat, indicating a lack of momentum.
Analysis
Over the past 3 months, GBPUSD has shown a bearish trend with significant support around 1.3400. The recent price action indicates a potential reversal, but the lack of strong bullish signals keeps the outlook cautious.
Confidence Level
Potential Risks
Market volatility and external news could impact the price direction.
1 Week Prediction
Target: July 29, 2025$1.345
$1.342
$1.35
$1.34
Description
A bullish engulfing pattern suggests a potential upward move. The MACD shows a bullish crossover, and the RSI is approaching overbought territory, indicating upward momentum.
Analysis
The past 3 months have seen fluctuating prices with a recent shift towards bullish sentiment. Key resistance at 1.3500 may pose challenges, but the overall trend appears to be improving.
Confidence Level
Potential Risks
Potential resistance at 1.3500 could limit gains, and geopolitical events may introduce volatility.
1 Month Prediction
Target: August 22, 2025$1.355
$1.35
$1.36
$1.35
Description
The bullish trend is supported by a series of higher lows and higher highs. The RSI indicates strong momentum, and the MACD remains positive. However, caution is warranted as the market may face resistance at 1.3600.
Analysis
The GBPUSD has shown a recovery from recent lows, with a bullish trend emerging. Key support at 1.3400 and resistance at 1.3600 will be critical in determining future price action.
Confidence Level
Potential Risks
Economic data releases could lead to unexpected volatility, impacting the forecast.
3 Months Prediction
Target: October 22, 2025$1.37
$1.365
$1.375
$1.36
Description
Long-term indicators suggest a bullish trend with potential for further gains. The Fibonacci retracement levels indicate support at 1.3600, while the MACD remains bullish. However, external economic factors could introduce risk.
Analysis
The overall trend in the last 3 months has been bearish, but recent price action suggests a potential reversal. Key resistance levels will need to be monitored closely as the market navigates through economic uncertainties.
Confidence Level
Potential Risks
Unforeseen macroeconomic events could lead to significant price fluctuations.