GOLD Trading Predictions
1 Day Prediction
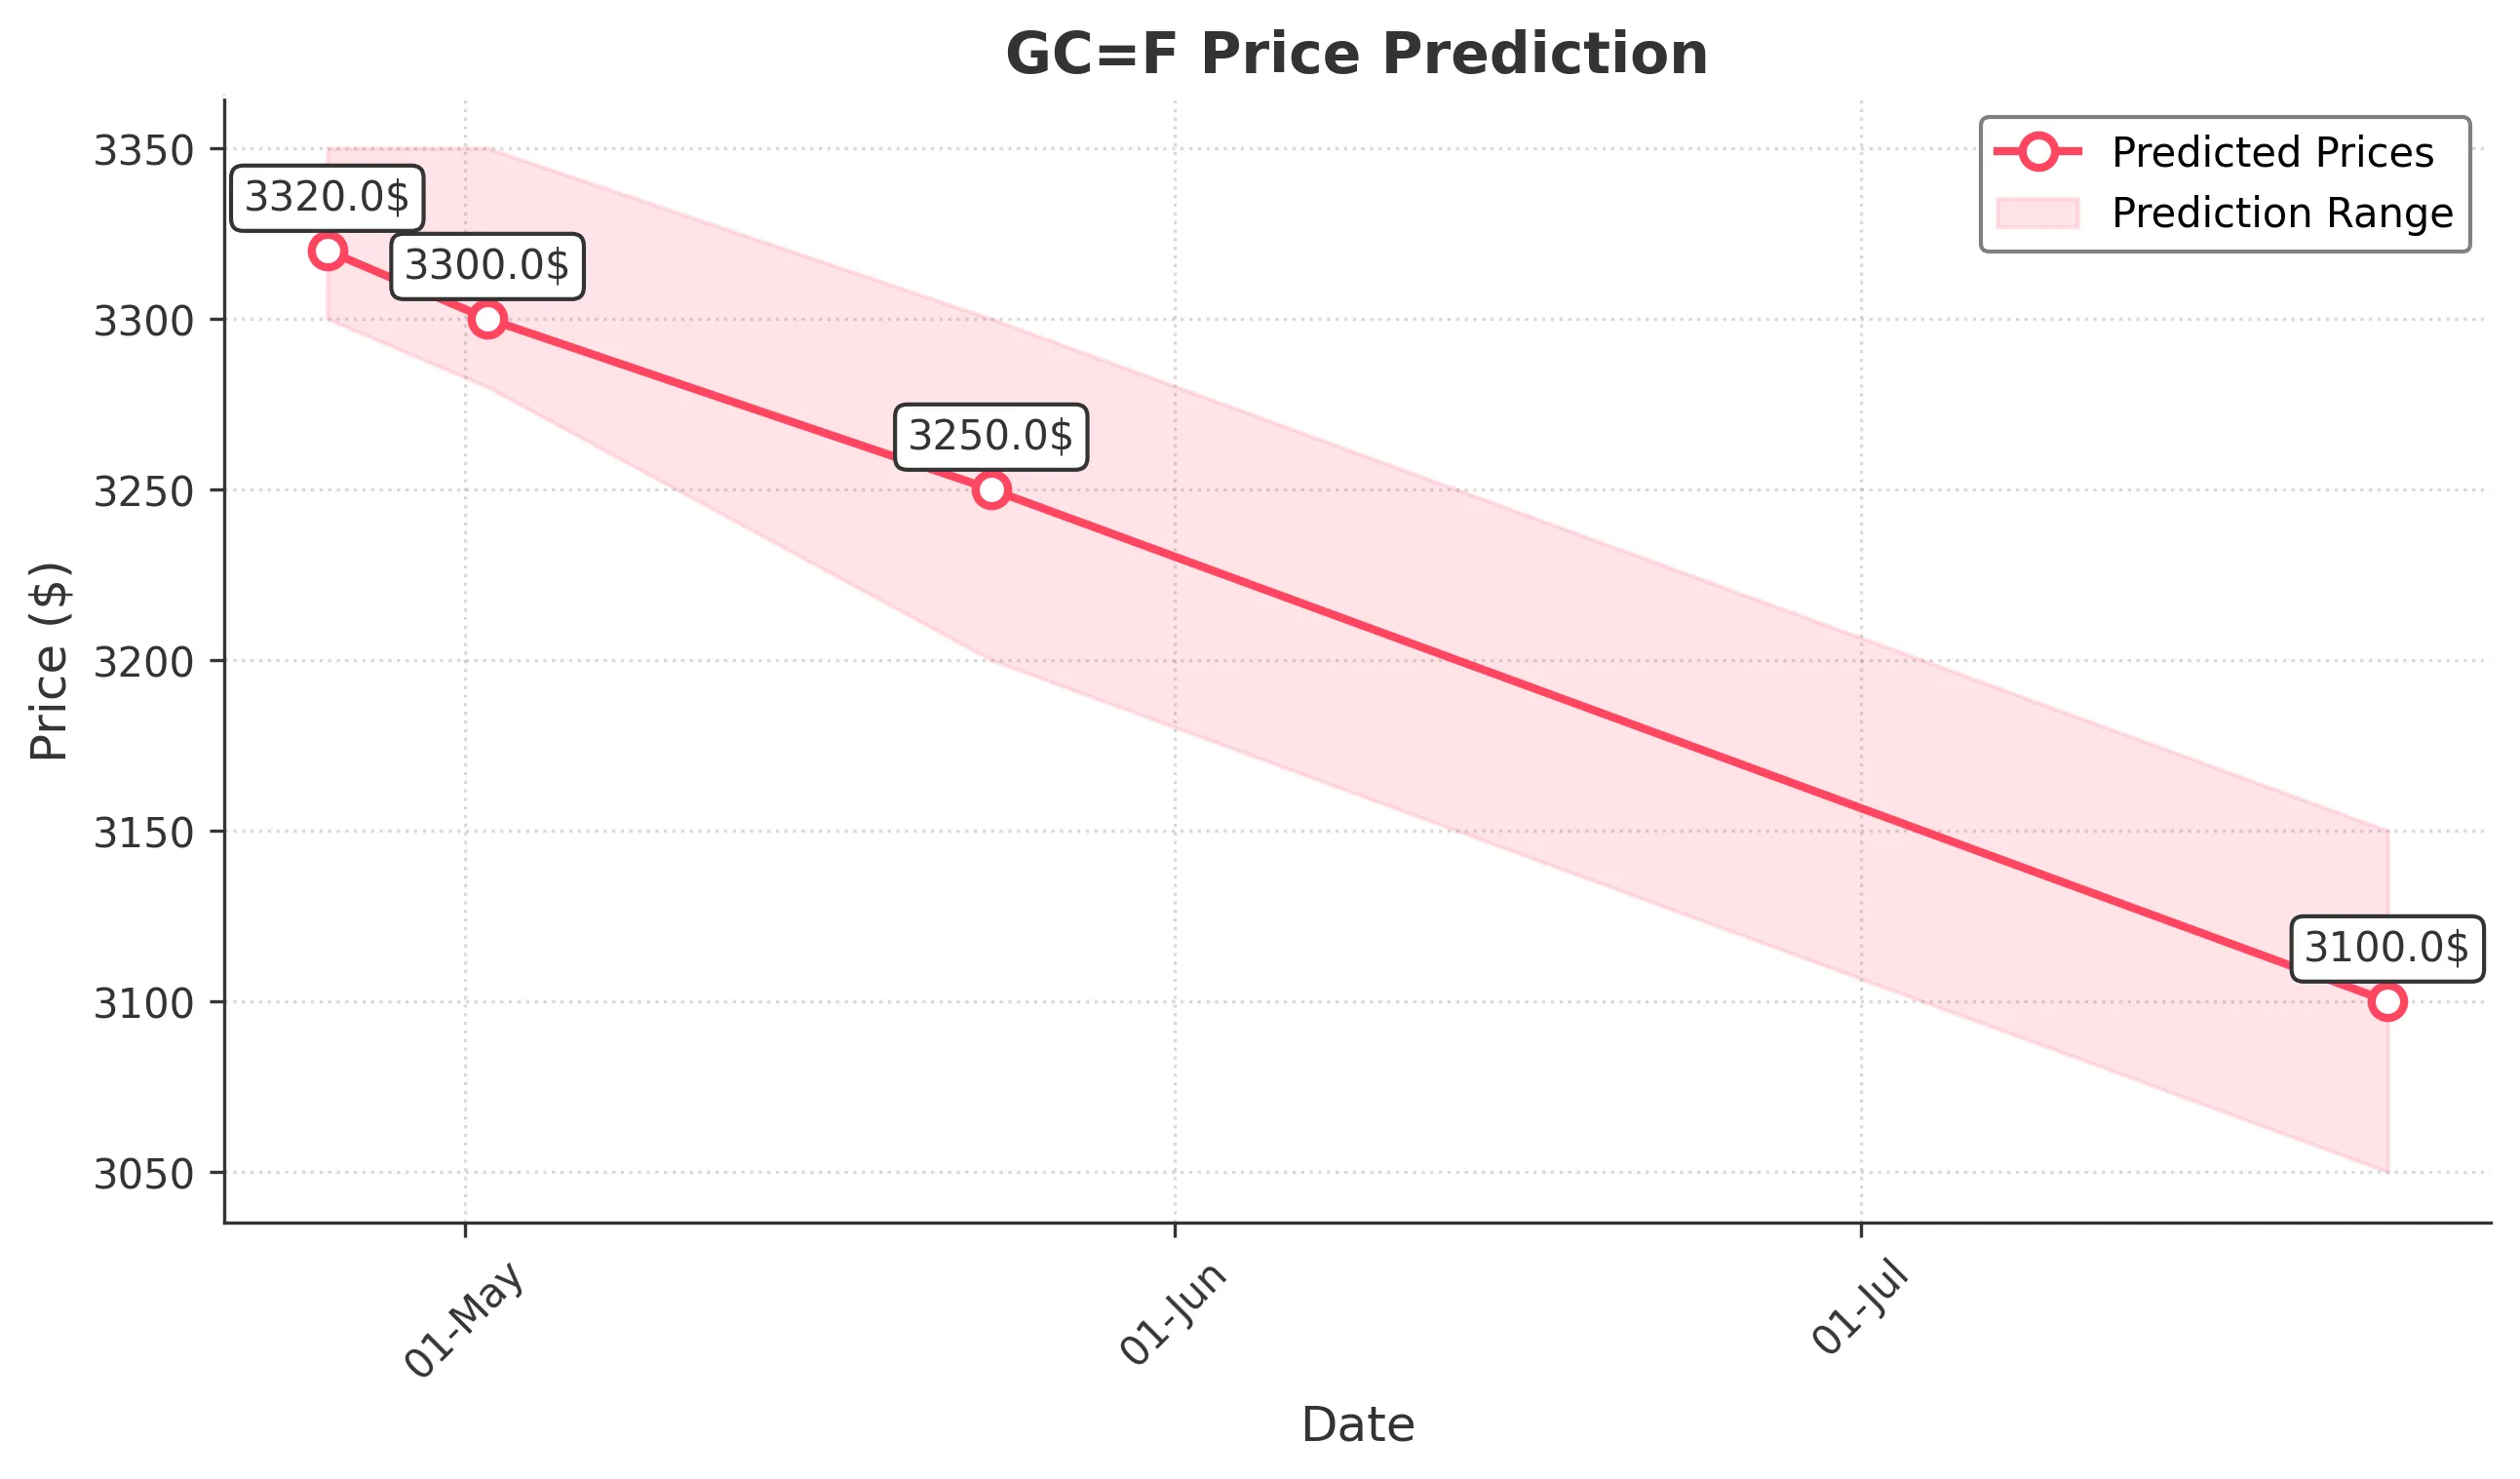
Target: April 25, 2025$3320
$3310
$3350
$3300
Description
The stock shows a slight bearish trend with a potential for a minor pullback. The recent candlestick patterns indicate indecision, and the RSI is approaching overbought levels. Volume spikes suggest profit-taking may occur.
Analysis
Over the past 3 months, GC=F has shown a bullish trend with significant upward movements. Key resistance is around 3400, while support is at 3200. The RSI indicates overbought conditions, and recent volume spikes suggest potential profit-taking.
Confidence Level
Potential Risks
Market volatility and external news could impact the price significantly.
1 Week Prediction
Target: May 2, 2025$3300
$3315
$3350
$3280
Description
Expect a consolidation phase as the stock may face resistance at 3350. The MACD shows a bearish crossover, indicating potential downward pressure. Volume analysis suggests traders are cautious, leading to a sideways movement.
Analysis
The stock has been in a bullish trend but is now showing signs of exhaustion. Key support at 3200 remains intact, while resistance at 3400 is a critical level. The ATR indicates increasing volatility, which could lead to price swings.
Confidence Level
Potential Risks
Unforeseen macroeconomic events could lead to volatility.
1 Month Prediction
Target: May 24, 2025$3250
$3280
$3300
$3200
Description
A bearish trend may develop as the stock approaches key support levels. The Bollinger Bands indicate potential price contraction, and the RSI suggests overbought conditions. A correction could lead to a test of lower support.
Analysis
GC=F has experienced significant volatility with a recent peak at 3400. The stock is now facing resistance and potential profit-taking. The overall trend remains bullish, but caution is warranted as indicators suggest a possible correction.
Confidence Level
Potential Risks
Market sentiment and economic indicators could shift rapidly, affecting predictions.
3 Months Prediction
Target: July 24, 2025$3100
$3120
$3150
$3050
Description
Long-term bearish sentiment may prevail as the stock approaches critical support levels. The MACD indicates a bearish divergence, and the RSI is trending downwards. A potential breakdown below 3100 could trigger further selling.
Analysis
The stock has shown a strong bullish trend but is now facing significant resistance. Key support at 3100 is critical; a breach could lead to further declines. The overall market sentiment is cautious, with potential for increased volatility.
Confidence Level
Potential Risks
Economic conditions and geopolitical events could drastically alter market dynamics.