GOLD Trading Predictions
1 Day Prediction
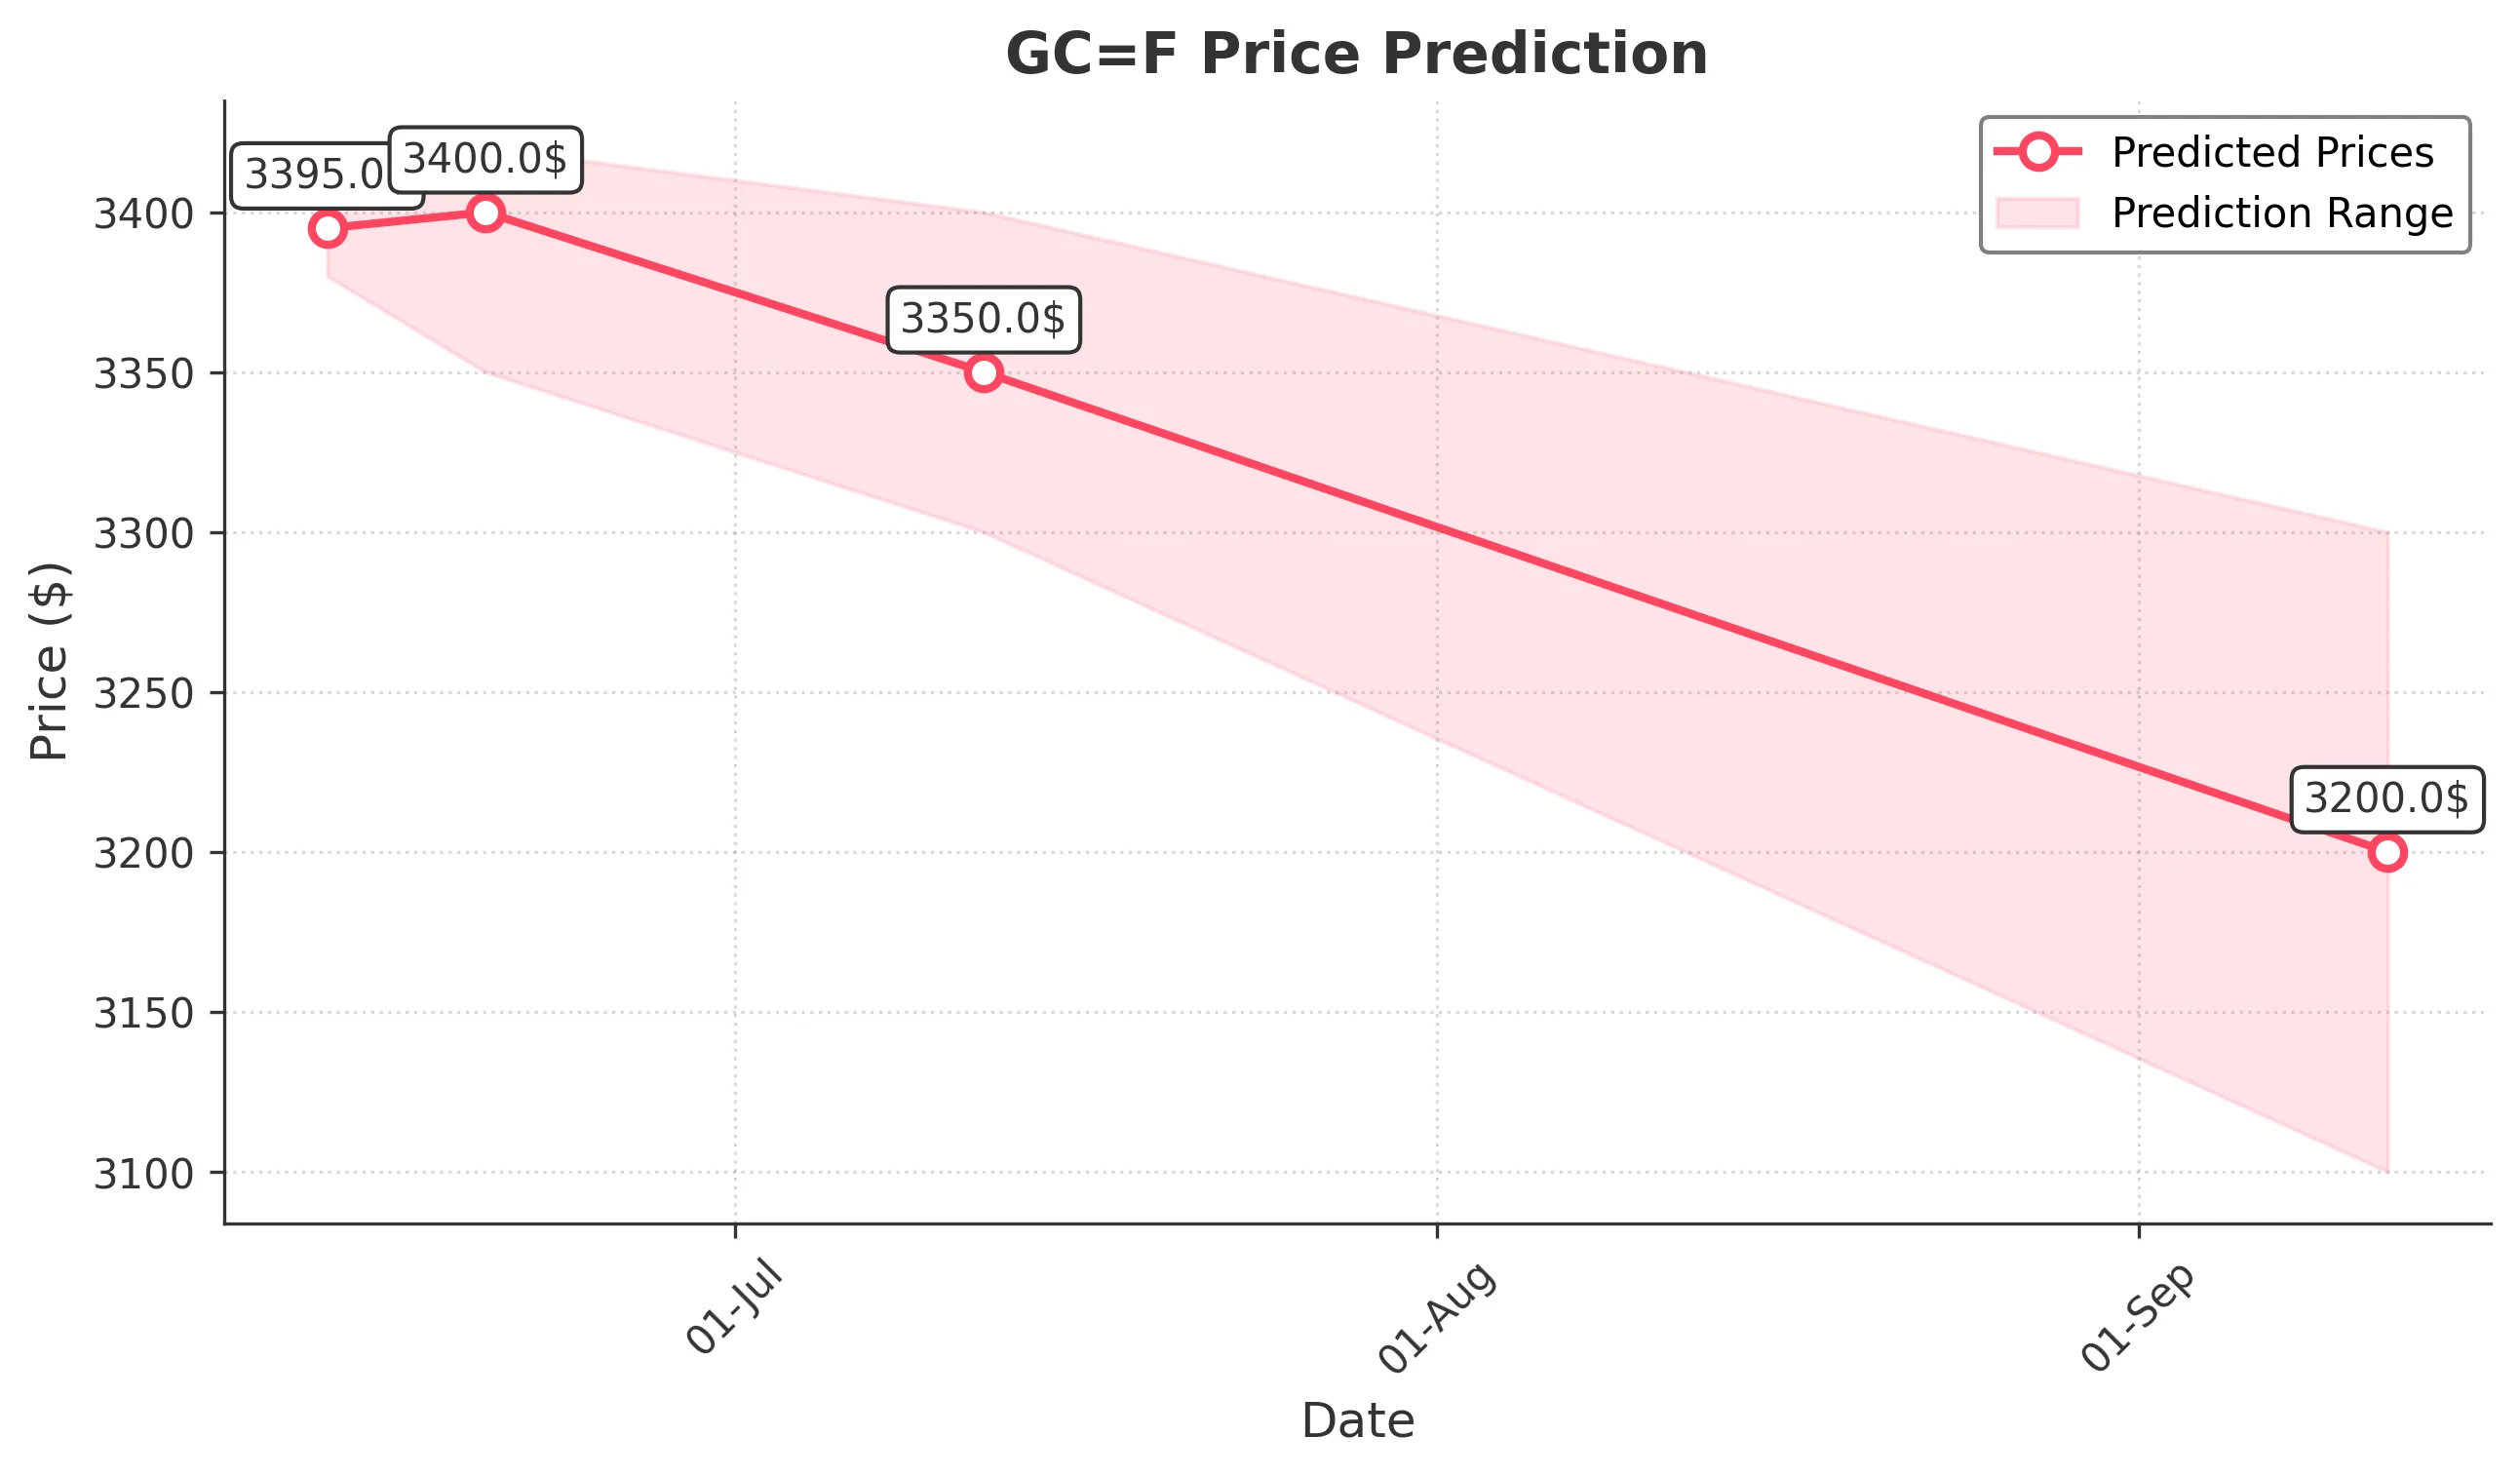
Target: June 13, 2025$3395
$3390
$3405
$3380
Description
The stock shows bullish momentum with a recent close above the 20-day moving average. RSI is nearing overbought territory, indicating potential for a pullback. However, strong buying volume suggests continued upward pressure.
Analysis
Over the past 3 months, GC=F has shown a bullish trend, with significant support at 3300 and resistance around 3400. The MACD is positive, and volume spikes indicate strong buying interest. Recent candlestick patterns suggest bullish continuation.
Confidence Level
Potential Risks
Potential reversal if RSI exceeds 70, indicating overbought conditions. Market sentiment could shift due to external news.
1 Week Prediction
Target: June 20, 2025$3400
$3395
$3420
$3350
Description
The stock is expected to consolidate around current levels, with potential for slight upward movement. The Bollinger Bands indicate tightening, suggesting a breakout could occur. Watch for volume trends to confirm direction.
Analysis
GC=F has been in a bullish phase, with key support at 3300. The MACD remains positive, and the RSI is approaching overbought levels. Volume analysis shows increased activity, indicating strong interest. However, caution is warranted as the market may react to macroeconomic news.
Confidence Level
Potential Risks
Market volatility and external economic factors could impact price movement. A bearish reversal pattern could emerge if the price fails to hold above 3400.
1 Month Prediction
Target: July 12, 2025$3350
$3390
$3400
$3300
Description
Expect a pullback as the stock approaches resistance levels. The RSI indicates overbought conditions, and profit-taking may occur. Watch for support at 3300 to hold; otherwise, further declines could follow.
Analysis
The stock has shown strong performance, but recent highs suggest a potential correction. Key support at 3300 is critical. The MACD is flattening, indicating a possible slowdown in momentum. Volume patterns suggest profit-taking may begin.
Confidence Level
Potential Risks
Unforeseen market events or economic data releases could lead to increased volatility. A break below 3300 would signal a bearish trend.
3 Months Prediction
Target: September 12, 2025$3200
$3250
$3300
$3100
Description
A bearish outlook as the stock may face headwinds from macroeconomic factors. The potential for a recession could weigh on prices, with key support at 3100. Watch for bearish patterns to confirm this trend.
Analysis
GC=F has experienced volatility, with a recent peak at 3400. The overall trend appears to be shifting bearish, with significant resistance at 3400. Volume analysis shows signs of distribution, and macroeconomic concerns could lead to a downturn.
Confidence Level
Potential Risks
Economic indicators and geopolitical events could significantly impact market sentiment. A failure to hold above 3200 could lead to further declines.