GOLD Trading Predictions
1 Day Prediction
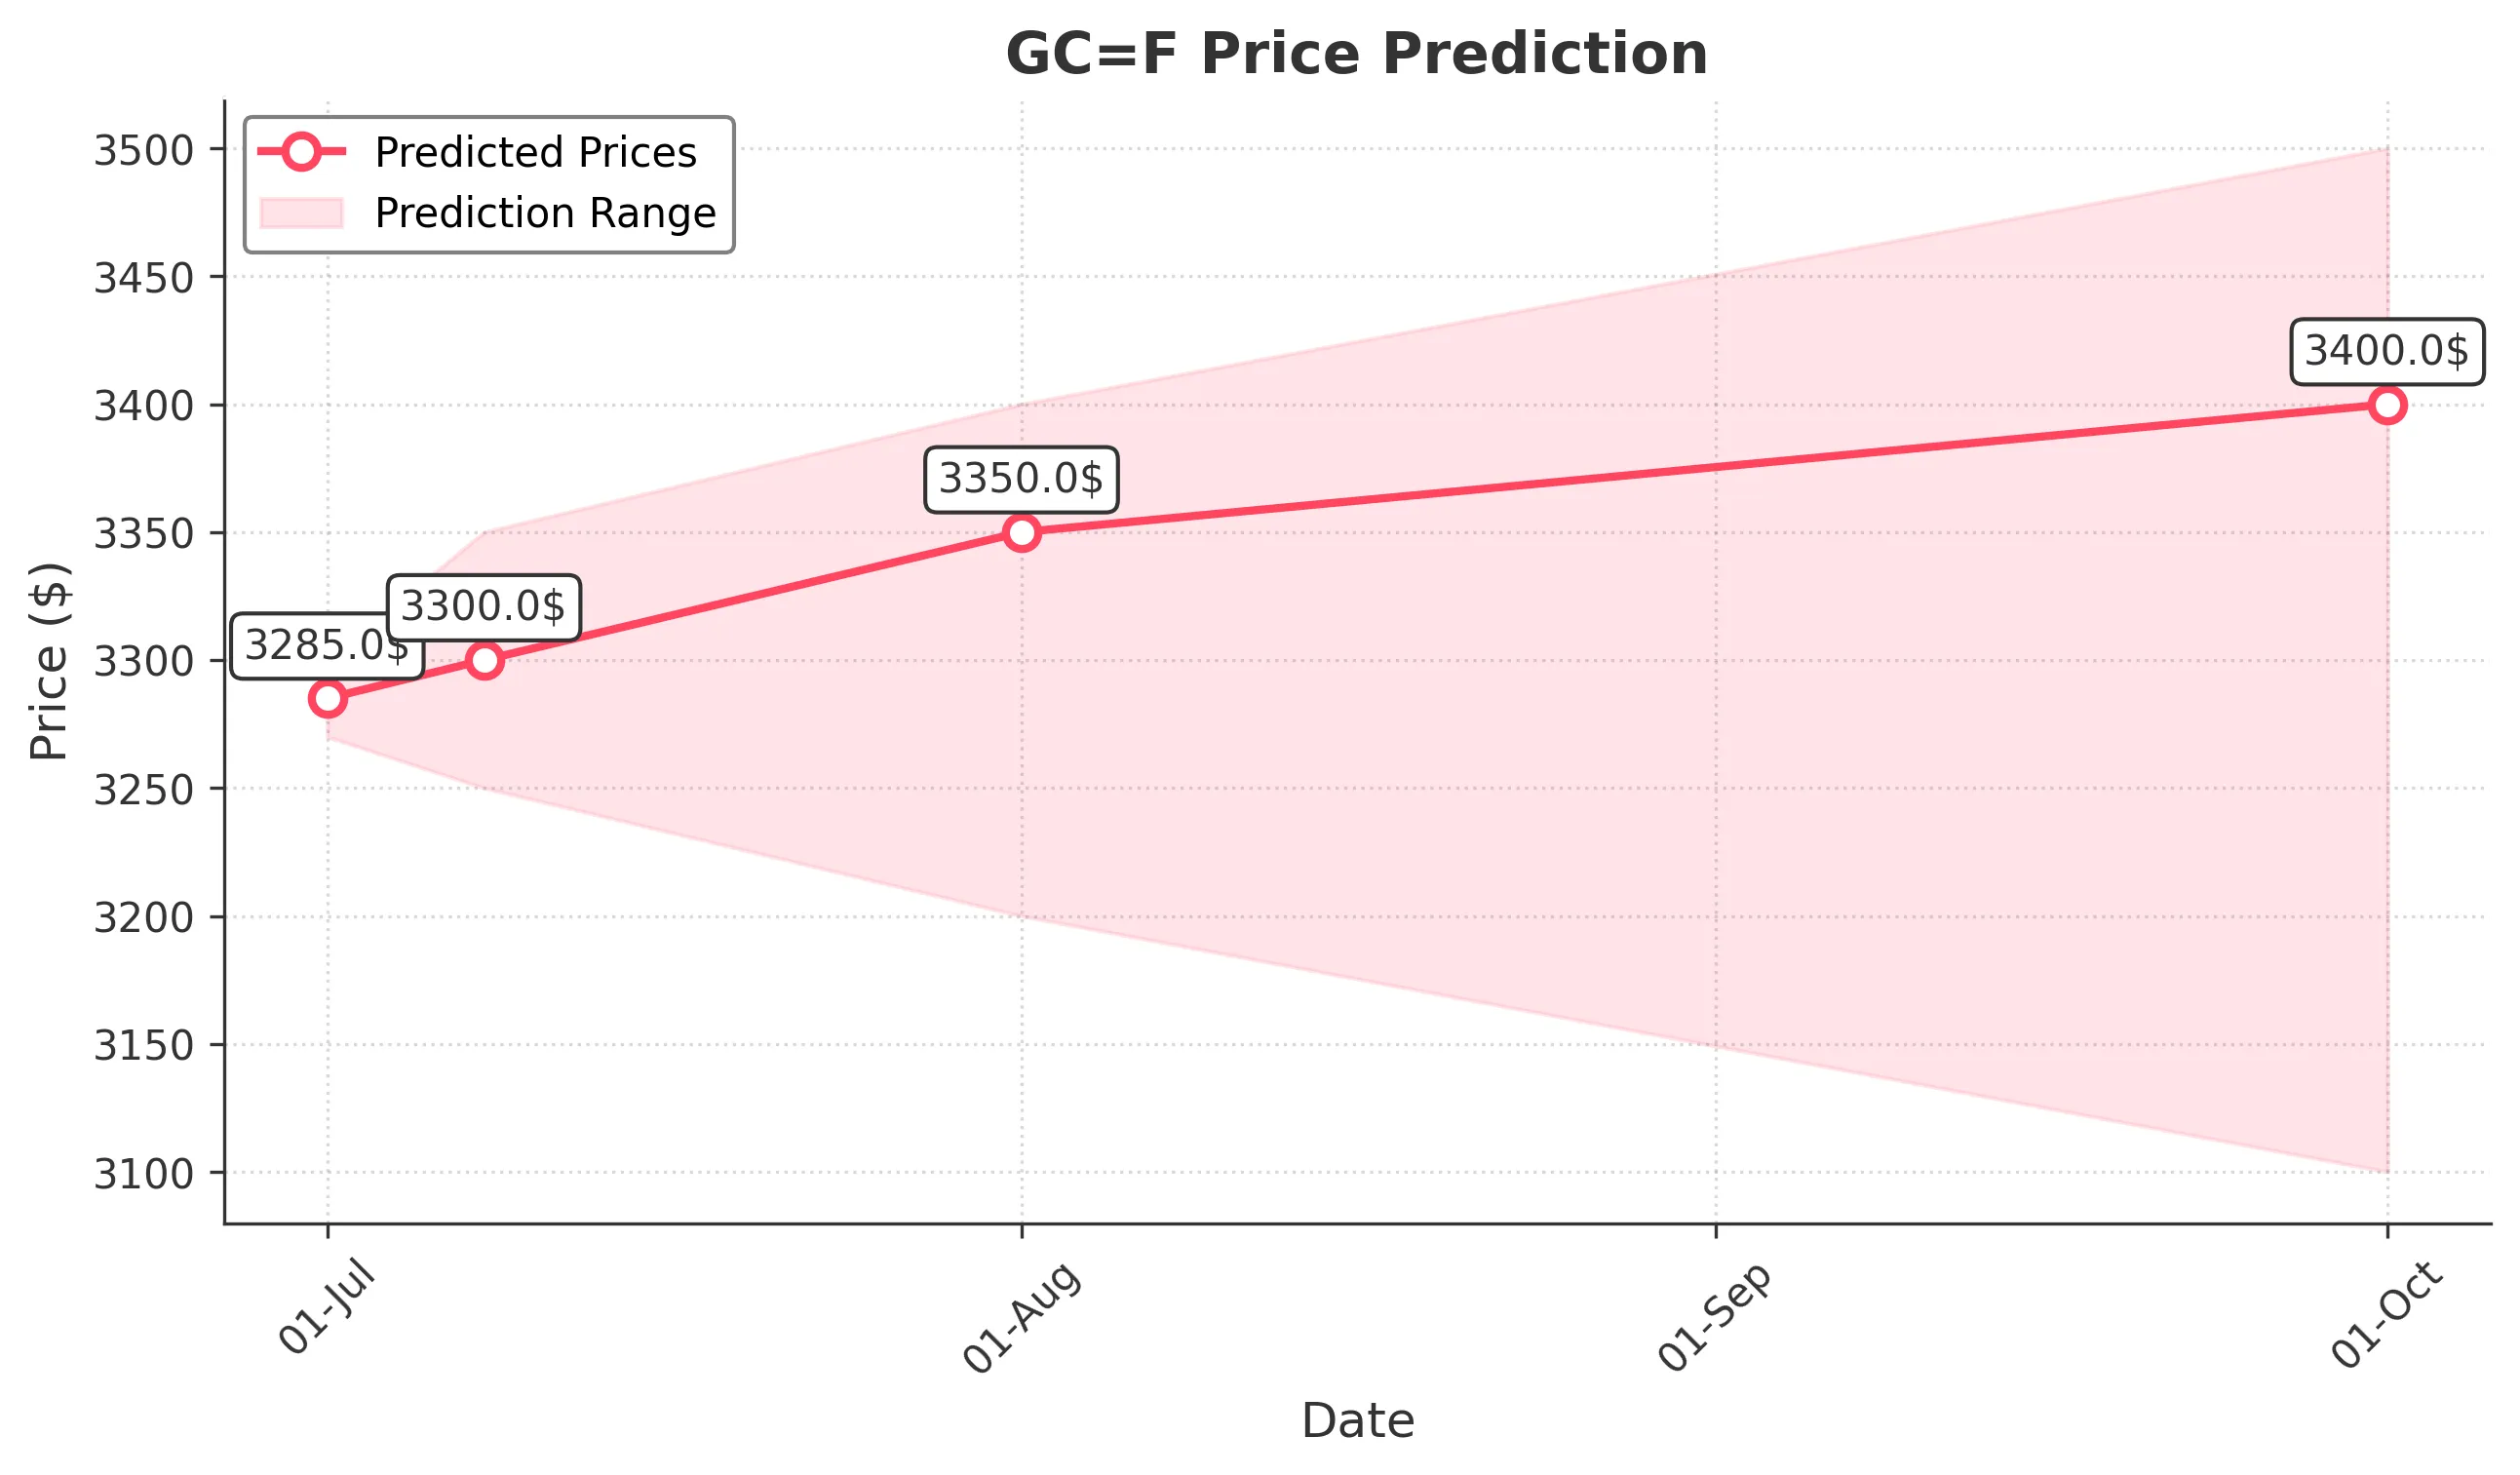
Target: July 1, 2025$3285
$3280
$3300
$3270
Description
The stock shows a slight bullish trend with a recent Doji pattern indicating indecision. RSI is neutral, and MACD is close to crossing above the signal line. Expect a minor upward movement.
Analysis
Over the past 3 months, GC=F has shown a bearish trend with significant fluctuations. Key support at 3270 and resistance at 3300. Volume has been inconsistent, indicating uncertainty. Recent candlestick patterns suggest potential for a short-term bounce.
Confidence Level
Potential Risks
Market volatility and external news could impact the price unexpectedly.
1 Week Prediction
Target: July 8, 2025$3300
$3285
$3350
$3250
Description
A potential recovery is indicated as the stock approaches a Fibonacci retracement level. The MACD shows bullish momentum, and the RSI is moving towards overbought territory. Expect a moderate rise.
Analysis
The stock has been in a bearish phase but shows signs of recovery. Key resistance at 3350 and support at 3250. Volume spikes on up days suggest accumulation. Technical indicators are mixed, indicating potential for a rebound.
Confidence Level
Potential Risks
Economic data releases could lead to volatility, affecting the prediction.
1 Month Prediction
Target: August 1, 2025$3350
$3300
$3400
$3200
Description
The stock is expected to stabilize around the 3350 level, supported by recent bullish patterns. The MACD is bullish, and the RSI is approaching overbought. However, caution is advised due to potential market corrections.
Analysis
GC=F has shown volatility with a recent bearish trend. Key support at 3200 and resistance at 3400. The stock's performance is influenced by external factors, and technical indicators suggest a cautious approach.
Confidence Level
Potential Risks
Unforeseen macroeconomic events could lead to price corrections.
3 Months Prediction
Target: October 1, 2025$3400
$3350
$3500
$3100
Description
Long-term outlook suggests a potential recovery towards 3400, driven by bullish sentiment and technical indicators. However, macroeconomic factors and market sentiment could lead to fluctuations.
Analysis
The stock has been in a bearish trend but shows signs of potential recovery. Key resistance at 3500 and support at 3100. Volume patterns indicate uncertainty, and external factors may influence future performance.
Confidence Level
Potential Risks
Economic instability and geopolitical events could significantly impact the stock's performance.