GOOG Trading Predictions
1 Day Prediction
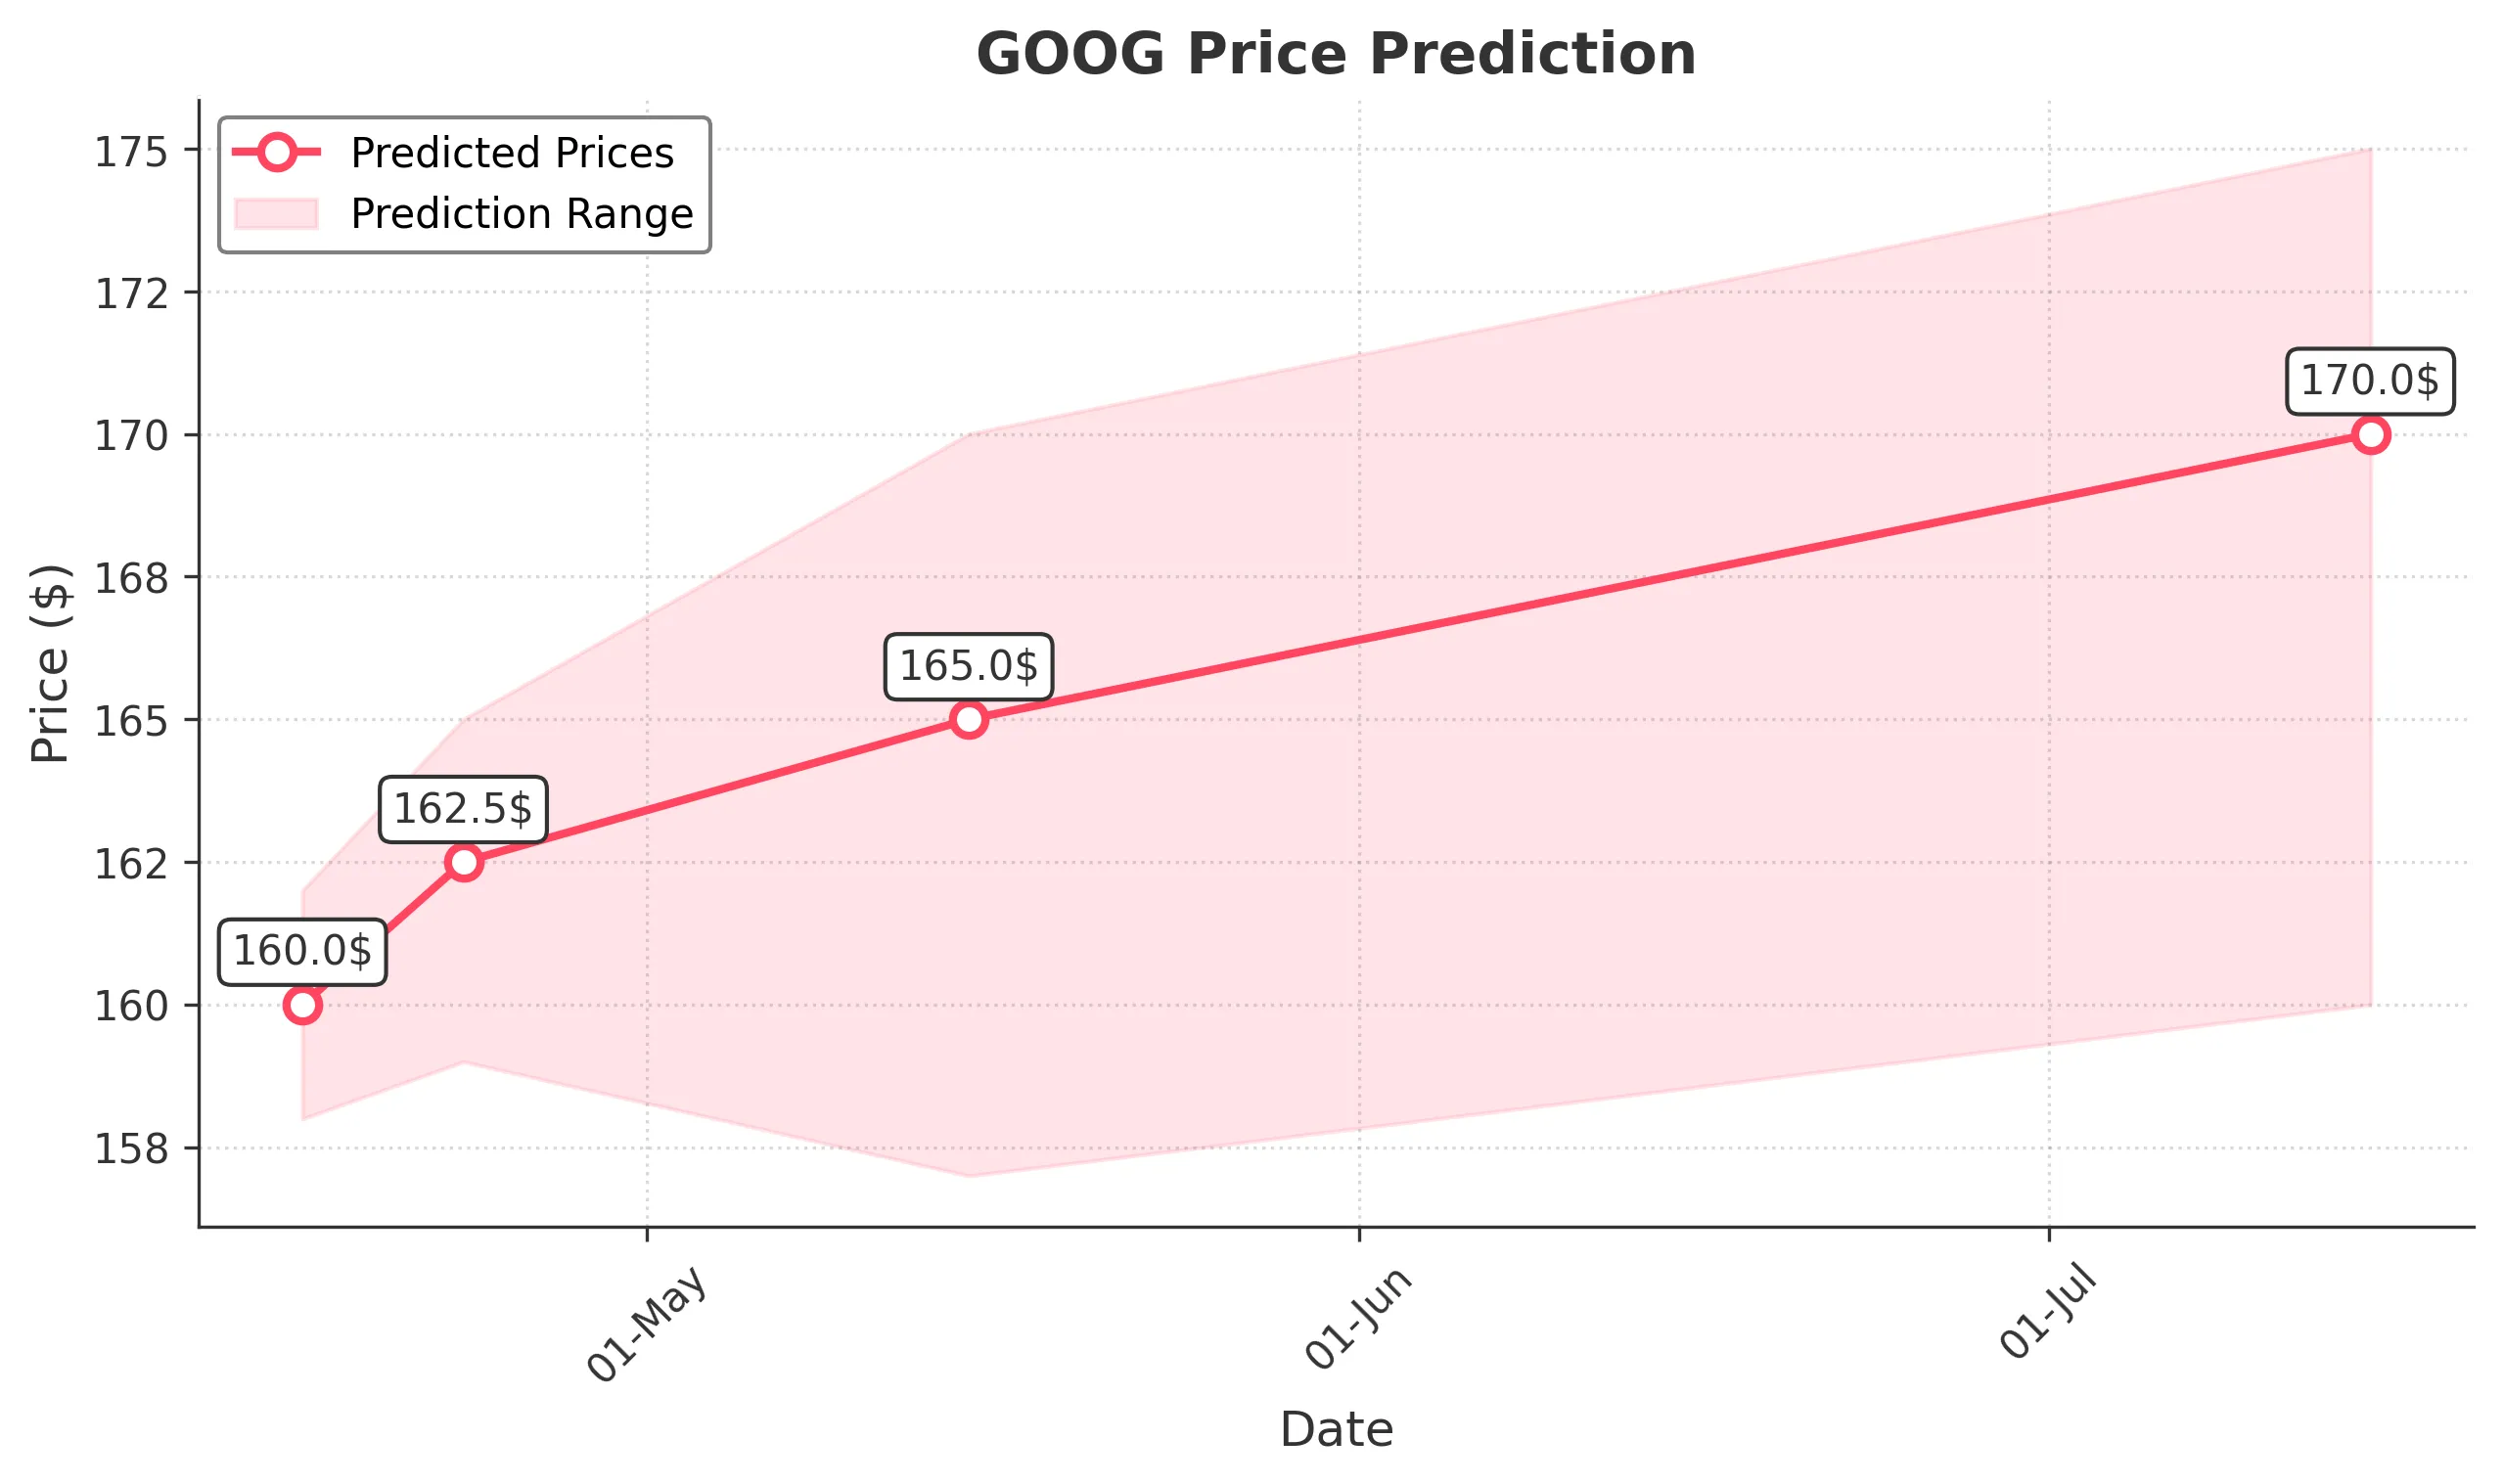
Target: April 16, 2025$160
$160.5
$162
$158
Description
The stock shows a slight bearish trend with recent lower highs and lows. RSI indicates oversold conditions, suggesting a potential bounce. However, MACD is bearish, and volume is declining, indicating caution.
Analysis
GOOG has experienced a bearish trend over the past three months, with significant support around $156. Recent volume spikes indicate selling pressure. Technical indicators like MACD and RSI suggest potential for a short-term bounce, but overall sentiment remains cautious.
Confidence Level
Potential Risks
Market volatility and external news could impact the prediction. A reversal is possible if bullish sentiment returns.
1 Week Prediction
Target: April 23, 2025$162.5
$161
$165
$159
Description
A potential recovery is indicated as the stock approaches key support levels. The RSI is improving, and MACD shows signs of a bullish crossover. However, resistance at $165 may limit upside.
Analysis
The stock has been in a downtrend, with significant resistance at $165. Recent candlestick patterns suggest indecision, and volume analysis shows a mix of buying and selling. The market sentiment is cautious, with potential for a short-term recovery.
Confidence Level
Potential Risks
Unforeseen macroeconomic events or earnings reports could lead to volatility. The bearish trend may still dominate if selling pressure continues.
1 Month Prediction
Target: May 15, 2025$165
$162
$170
$157
Description
The stock may stabilize around $165, with potential for a gradual recovery. Technical indicators suggest a bullish divergence forming, but resistance levels remain a concern.
Analysis
GOOG has shown a bearish trend with significant support at $156. The stock's performance has been volatile, with mixed signals from technical indicators. Volume patterns indicate uncertainty, and macroeconomic factors could influence future performance.
Confidence Level
Potential Risks
Market conditions and external factors could lead to further declines. The bearish trend may persist if selling pressure continues.
3 Months Prediction
Target: July 15, 2025$170
$168
$175
$160
Description
A potential recovery trend may emerge if the stock breaks above resistance levels. Positive market sentiment and improved earnings could support this move.
Analysis
The stock has been in a bearish phase, with significant resistance at $175. Technical indicators show mixed signals, and volume analysis indicates uncertainty. Macroeconomic factors and market sentiment will play crucial roles in determining future performance.
Confidence Level
Potential Risks
Long-term predictions are uncertain due to market volatility and potential economic downturns. A bearish trend could resume if external factors negatively impact sentiment.