GOOG Trading Predictions
1 Day Prediction
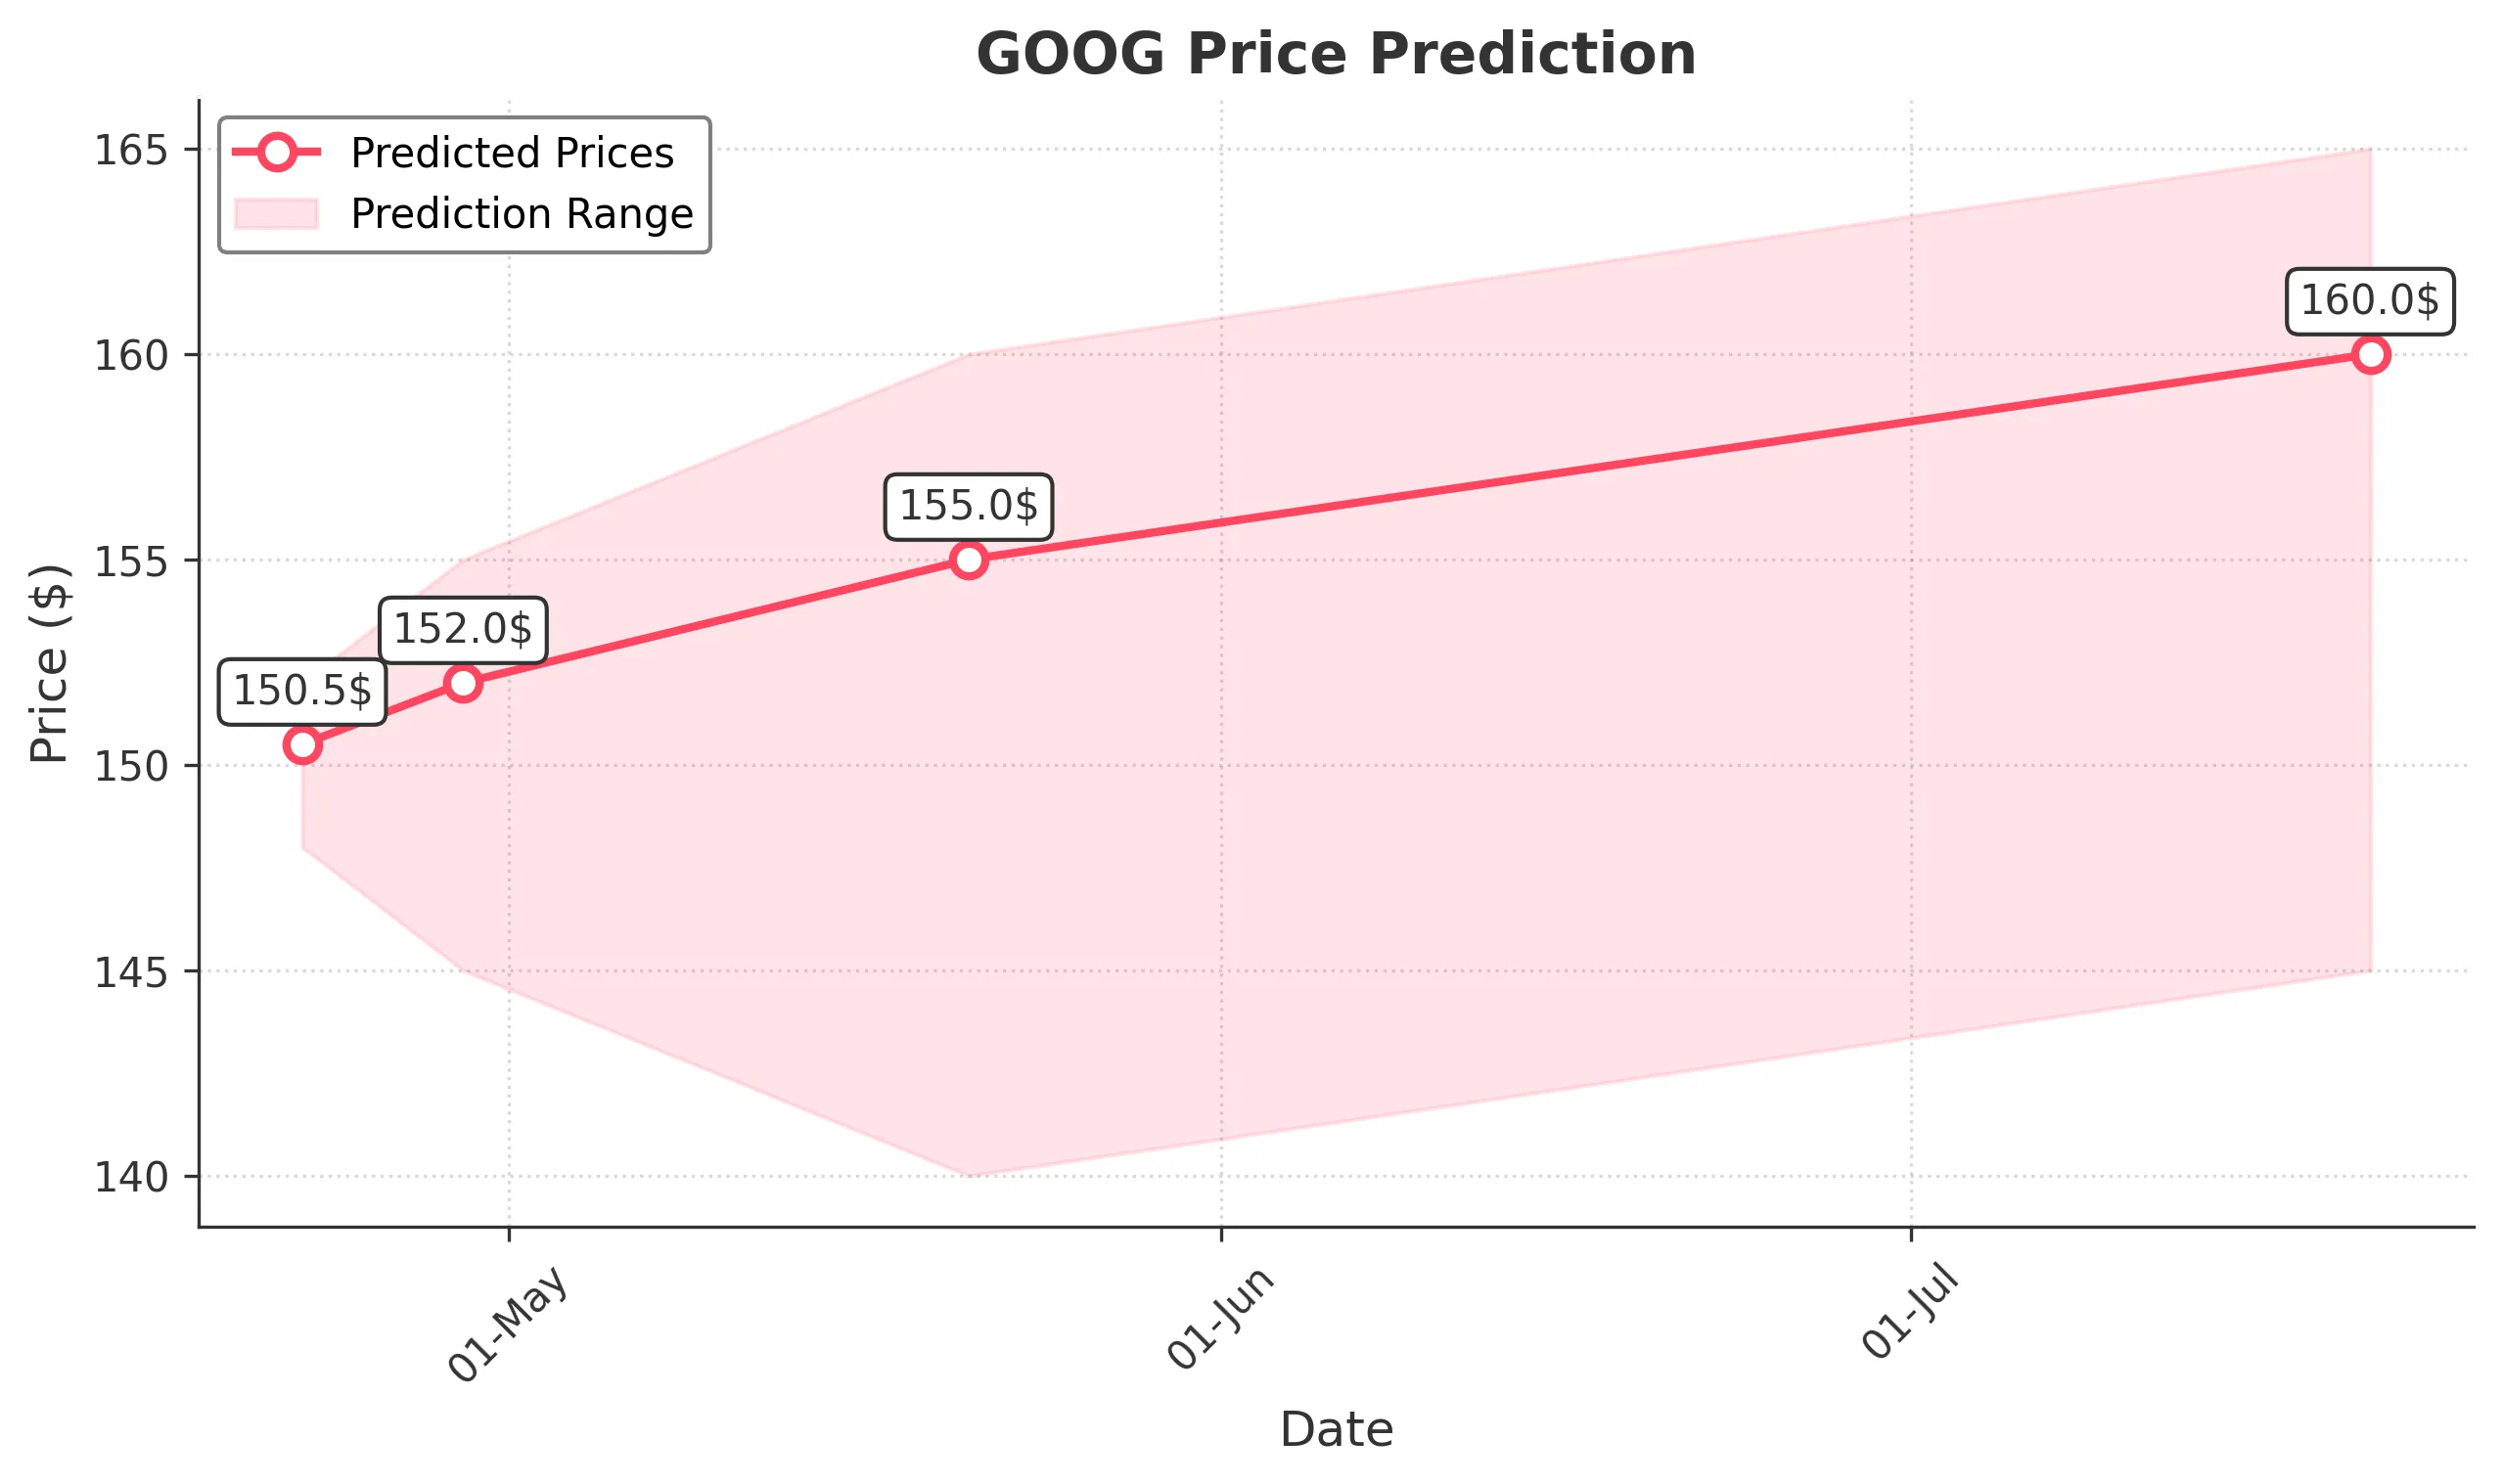
Target: April 22, 2025$150.5
$149.5
$152
$148
Description
The stock shows bearish momentum with a recent downtrend. RSI indicates oversold conditions, but MACD is bearish. Volume spikes suggest selling pressure. Expect a slight recovery but overall bearish sentiment persists.
Analysis
GOOG has been in a bearish trend over the past three months, with significant support around $150. Recent volume spikes indicate selling pressure. Technical indicators like MACD and RSI suggest potential for a short-term bounce, but overall sentiment remains cautious.
Confidence Level
Potential Risks
Market volatility and potential news could impact the prediction. A reversal is possible if bullish sentiment returns.
1 Week Prediction
Target: April 29, 2025$152
$150
$155
$145
Description
A slight recovery is anticipated as the stock may find support at $150. However, bearish indicators persist. Watch for potential resistance at $155. Market sentiment remains cautious, influenced by macroeconomic factors.
Analysis
The stock has shown a bearish trend with significant resistance at $155. Volume analysis indicates selling pressure, while technical indicators suggest a potential short-term recovery. Overall, the market sentiment is cautious, influenced by broader economic conditions.
Confidence Level
Potential Risks
Unforeseen macroeconomic events or earnings reports could lead to volatility. The bearish trend may continue if selling pressure remains strong.
1 Month Prediction
Target: May 21, 2025$155
$150
$160
$140
Description
Expect a gradual recovery as the stock may stabilize around $155. However, bearish trends and macroeconomic factors could limit upside potential. Watch for resistance at $160.
Analysis
GOOG's performance has been bearish, with significant support at $150. Technical indicators suggest potential stabilization, but overall market sentiment remains cautious. Volume patterns indicate selling pressure, and macroeconomic influences could affect future performance.
Confidence Level
Potential Risks
Market volatility and external economic factors could impact the stock's performance. A bearish reversal remains a possibility.
3 Months Prediction
Target: July 21, 2025$160
$155
$165
$145
Description
A potential recovery to $160 is expected, driven by improved market sentiment and stabilization in the tech sector. However, bearish trends may still pose risks.
Analysis
The stock has been in a bearish trend, with significant resistance at $160. While there are signs of potential recovery, overall market sentiment remains cautious. Technical indicators suggest a possible stabilization, but external economic factors could influence future performance.
Confidence Level
Potential Risks
Long-term predictions are uncertain due to potential market volatility and economic conditions. A bearish trend could persist if external factors negatively impact the tech sector.