GOOG Trading Predictions
1 Day Prediction
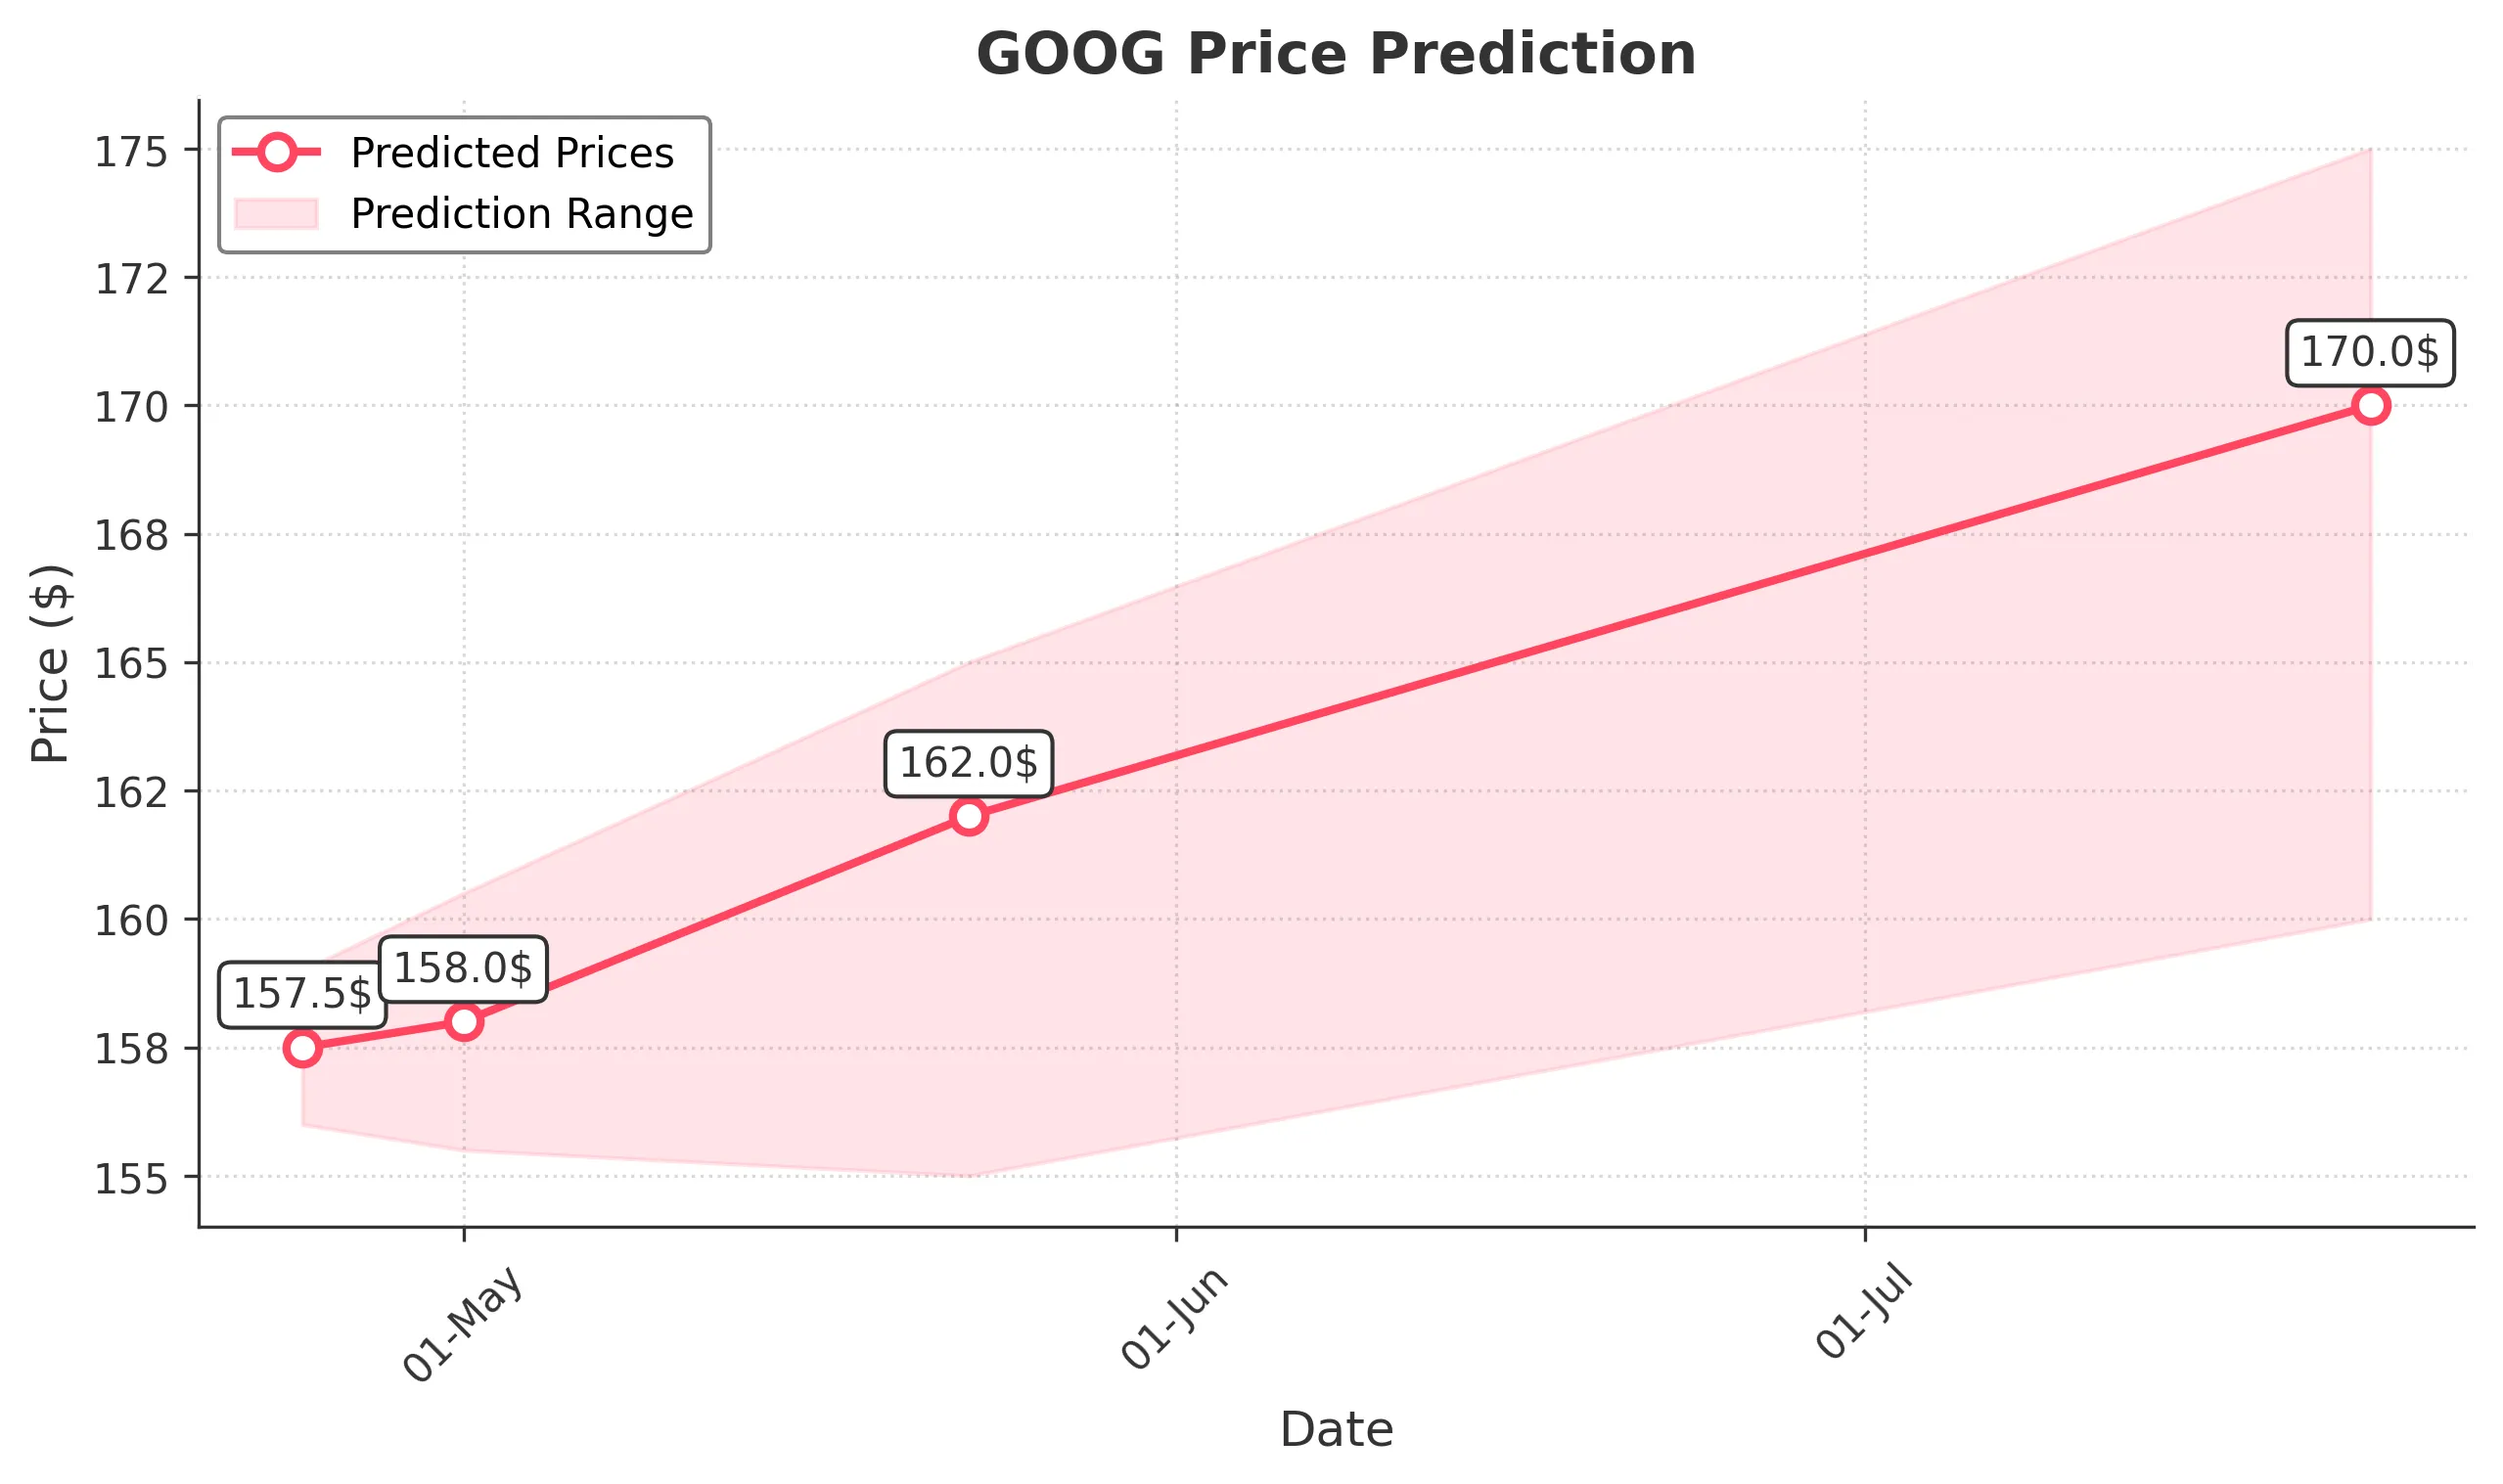
Target: April 24, 2025$157.5
$157
$159
$156
Description
The stock shows a slight bullish trend with a potential close around 157.500. The RSI is neutral, and MACD indicates a potential upward momentum. However, recent volatility suggests caution.
Analysis
GOOG has shown a bearish trend recently, with significant support at 150. The RSI is around 50, indicating indecision. Volume spikes on down days suggest selling pressure, while recent candlestick patterns show potential for a short-term bounce.
Confidence Level
Potential Risks
Market sentiment could shift due to external news or earnings reports, impacting the prediction.
1 Week Prediction
Target: May 1, 2025$158
$157.5
$160.5
$155.5
Description
Expect a close around 158.000 as the stock may stabilize after recent declines. The Bollinger Bands indicate potential for a rebound, but caution is warranted due to overall market sentiment.
Analysis
The stock has been in a downtrend, with resistance at 160. Recent volume patterns indicate increased selling. The MACD is bearish, and the ATR suggests heightened volatility, indicating uncertainty in the near term.
Confidence Level
Potential Risks
Potential for further declines exists if broader market conditions worsen or if earnings disappoint.
1 Month Prediction
Target: May 23, 2025$162
$160
$165
$155
Description
A potential recovery to 162.000 is expected as the stock may find support at lower levels. The Fibonacci retracement levels suggest a bounce back, but macroeconomic factors could influence this.
Analysis
GOOG has faced significant selling pressure, with key support at 150. The RSI is approaching oversold levels, indicating a potential reversal. However, external factors like interest rates and tech sector performance could affect future movements.
Confidence Level
Potential Risks
Economic indicators and earnings reports could lead to volatility, impacting the stock's recovery.
3 Months Prediction
Target: July 23, 2025$170
$165
$175
$160
Description
In three months, a gradual recovery to 170.000 is anticipated as market conditions stabilize. The stock may benefit from positive earnings and improved sentiment in the tech sector.
Analysis
The stock has been volatile, with a bearish trend recently. Key resistance levels are at 175, while support remains at 150. The MACD shows signs of potential recovery, but external economic factors could heavily influence the stock's trajectory.
Confidence Level
Potential Risks
Long-term predictions are uncertain due to potential market corrections and economic shifts.