GOOG Trading Predictions
1 Day Prediction
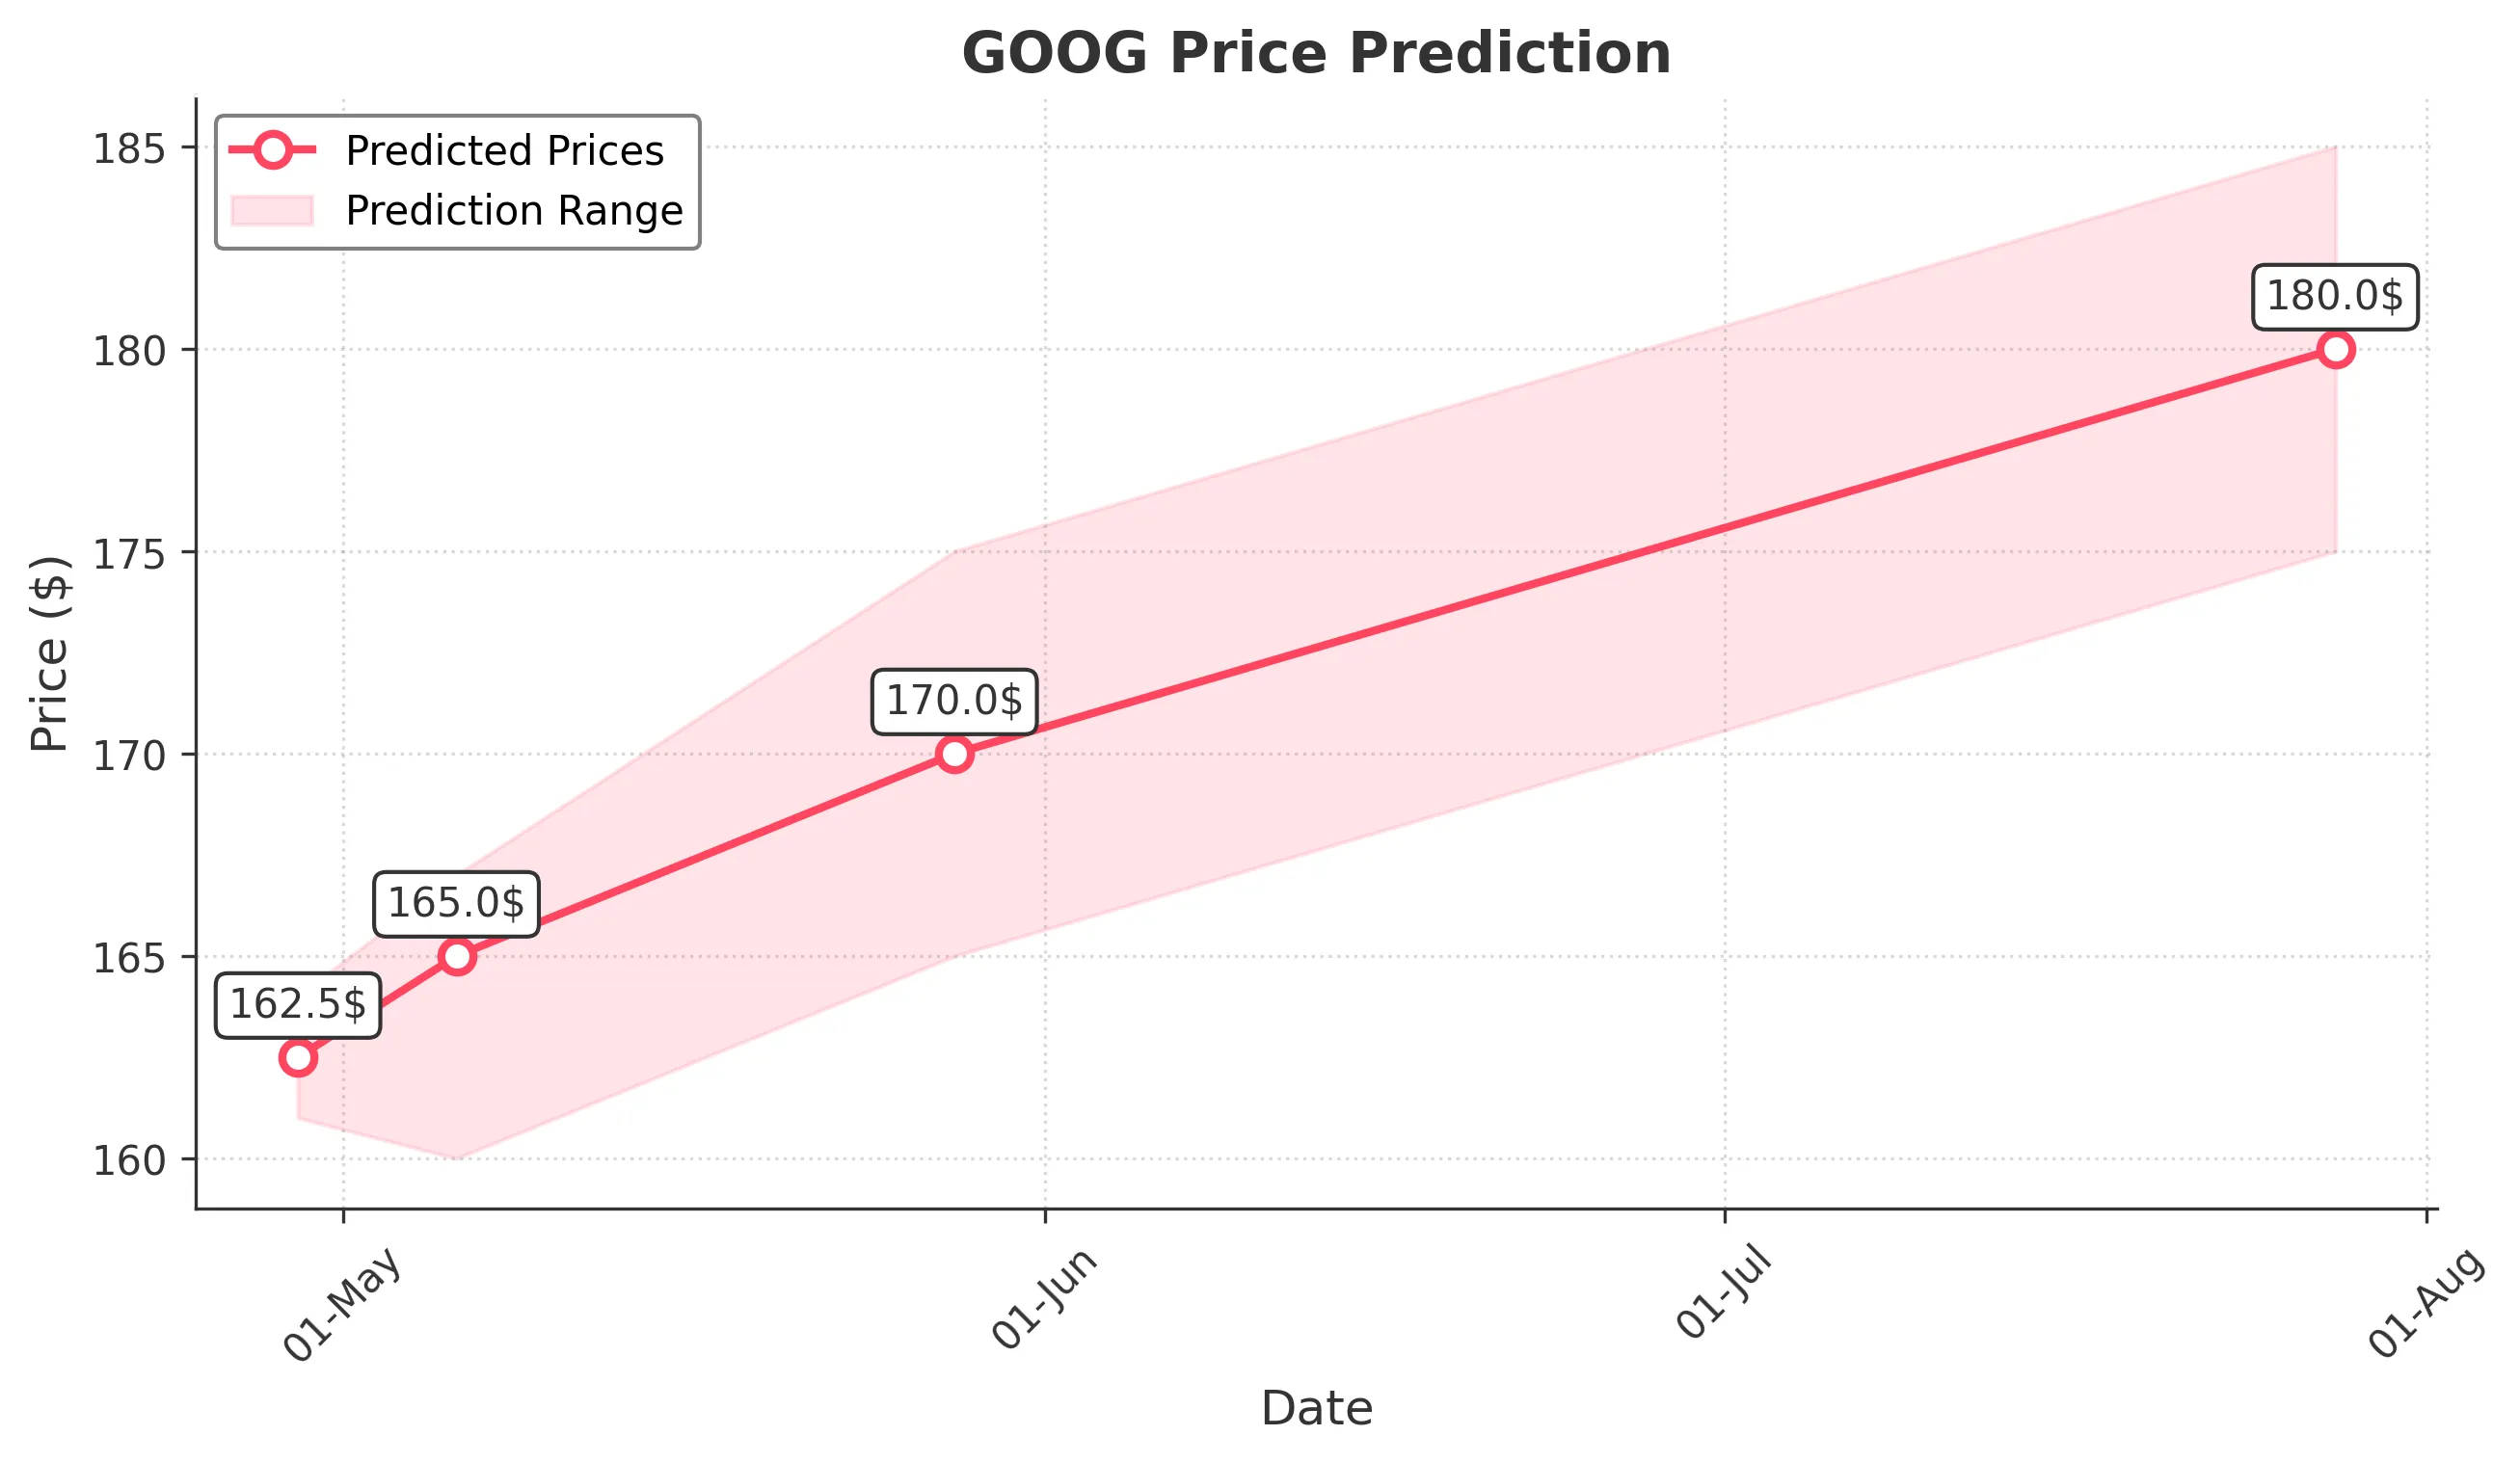
Target: April 29, 2025$162.5
$162
$164
$161
Description
The stock shows a slight recovery after recent declines, supported by a bullish engulfing pattern. RSI indicates oversold conditions, suggesting a potential bounce. However, resistance at 164.00 may limit upside.
Analysis
GOOG has been in a bearish trend recently, with significant support around 160.00. The recent volume spikes indicate increased selling pressure. Technical indicators like MACD are showing bearish momentum, while Bollinger Bands suggest potential for a short-term reversal.
Confidence Level
Potential Risks
Market volatility and external news could impact the prediction. A failure to break resistance may lead to further declines.
1 Week Prediction
Target: May 6, 2025$165
$162.5
$167
$160
Description
A potential recovery is anticipated as the stock approaches key support levels. The RSI is improving, indicating a possible upward momentum. However, resistance at 167.00 remains a concern.
Analysis
The stock has shown signs of stabilization after a sharp decline. Key support at 160.00 is holding, but the overall trend remains bearish. Volume analysis indicates a potential for recovery, but external factors could influence price movements.
Confidence Level
Potential Risks
Uncertainty in market sentiment and macroeconomic factors could lead to unexpected volatility, impacting the prediction.
1 Month Prediction
Target: May 28, 2025$170
$166
$175
$165
Description
If the stock can maintain above 160.00, a gradual recovery towards 170.00 is expected. The MACD shows signs of bullish divergence, suggesting potential upward momentum.
Analysis
GOOG has been experiencing a bearish trend, but recent price action suggests a possible bottoming out. Key resistance levels are at 175.00, while support remains at 160.00. The overall market sentiment is cautious, influenced by macroeconomic factors.
Confidence Level
Potential Risks
Market conditions and potential negative news could derail the recovery, leading to further declines.
3 Months Prediction
Target: July 28, 2025$180
$178
$185
$175
Description
Assuming a recovery continues, the stock could reach 180.00 as it breaks through resistance levels. However, macroeconomic factors and earnings reports will play a crucial role.
Analysis
The stock has been in a bearish phase, but signs of recovery are emerging. Key resistance at 175.00 must be overcome for a bullish trend. Volume patterns indicate increased interest, but external factors could lead to volatility.
Confidence Level
Potential Risks
Long-term predictions are uncertain due to potential market shifts and economic conditions that could impact performance.