GOOG Trading Predictions
1 Day Prediction
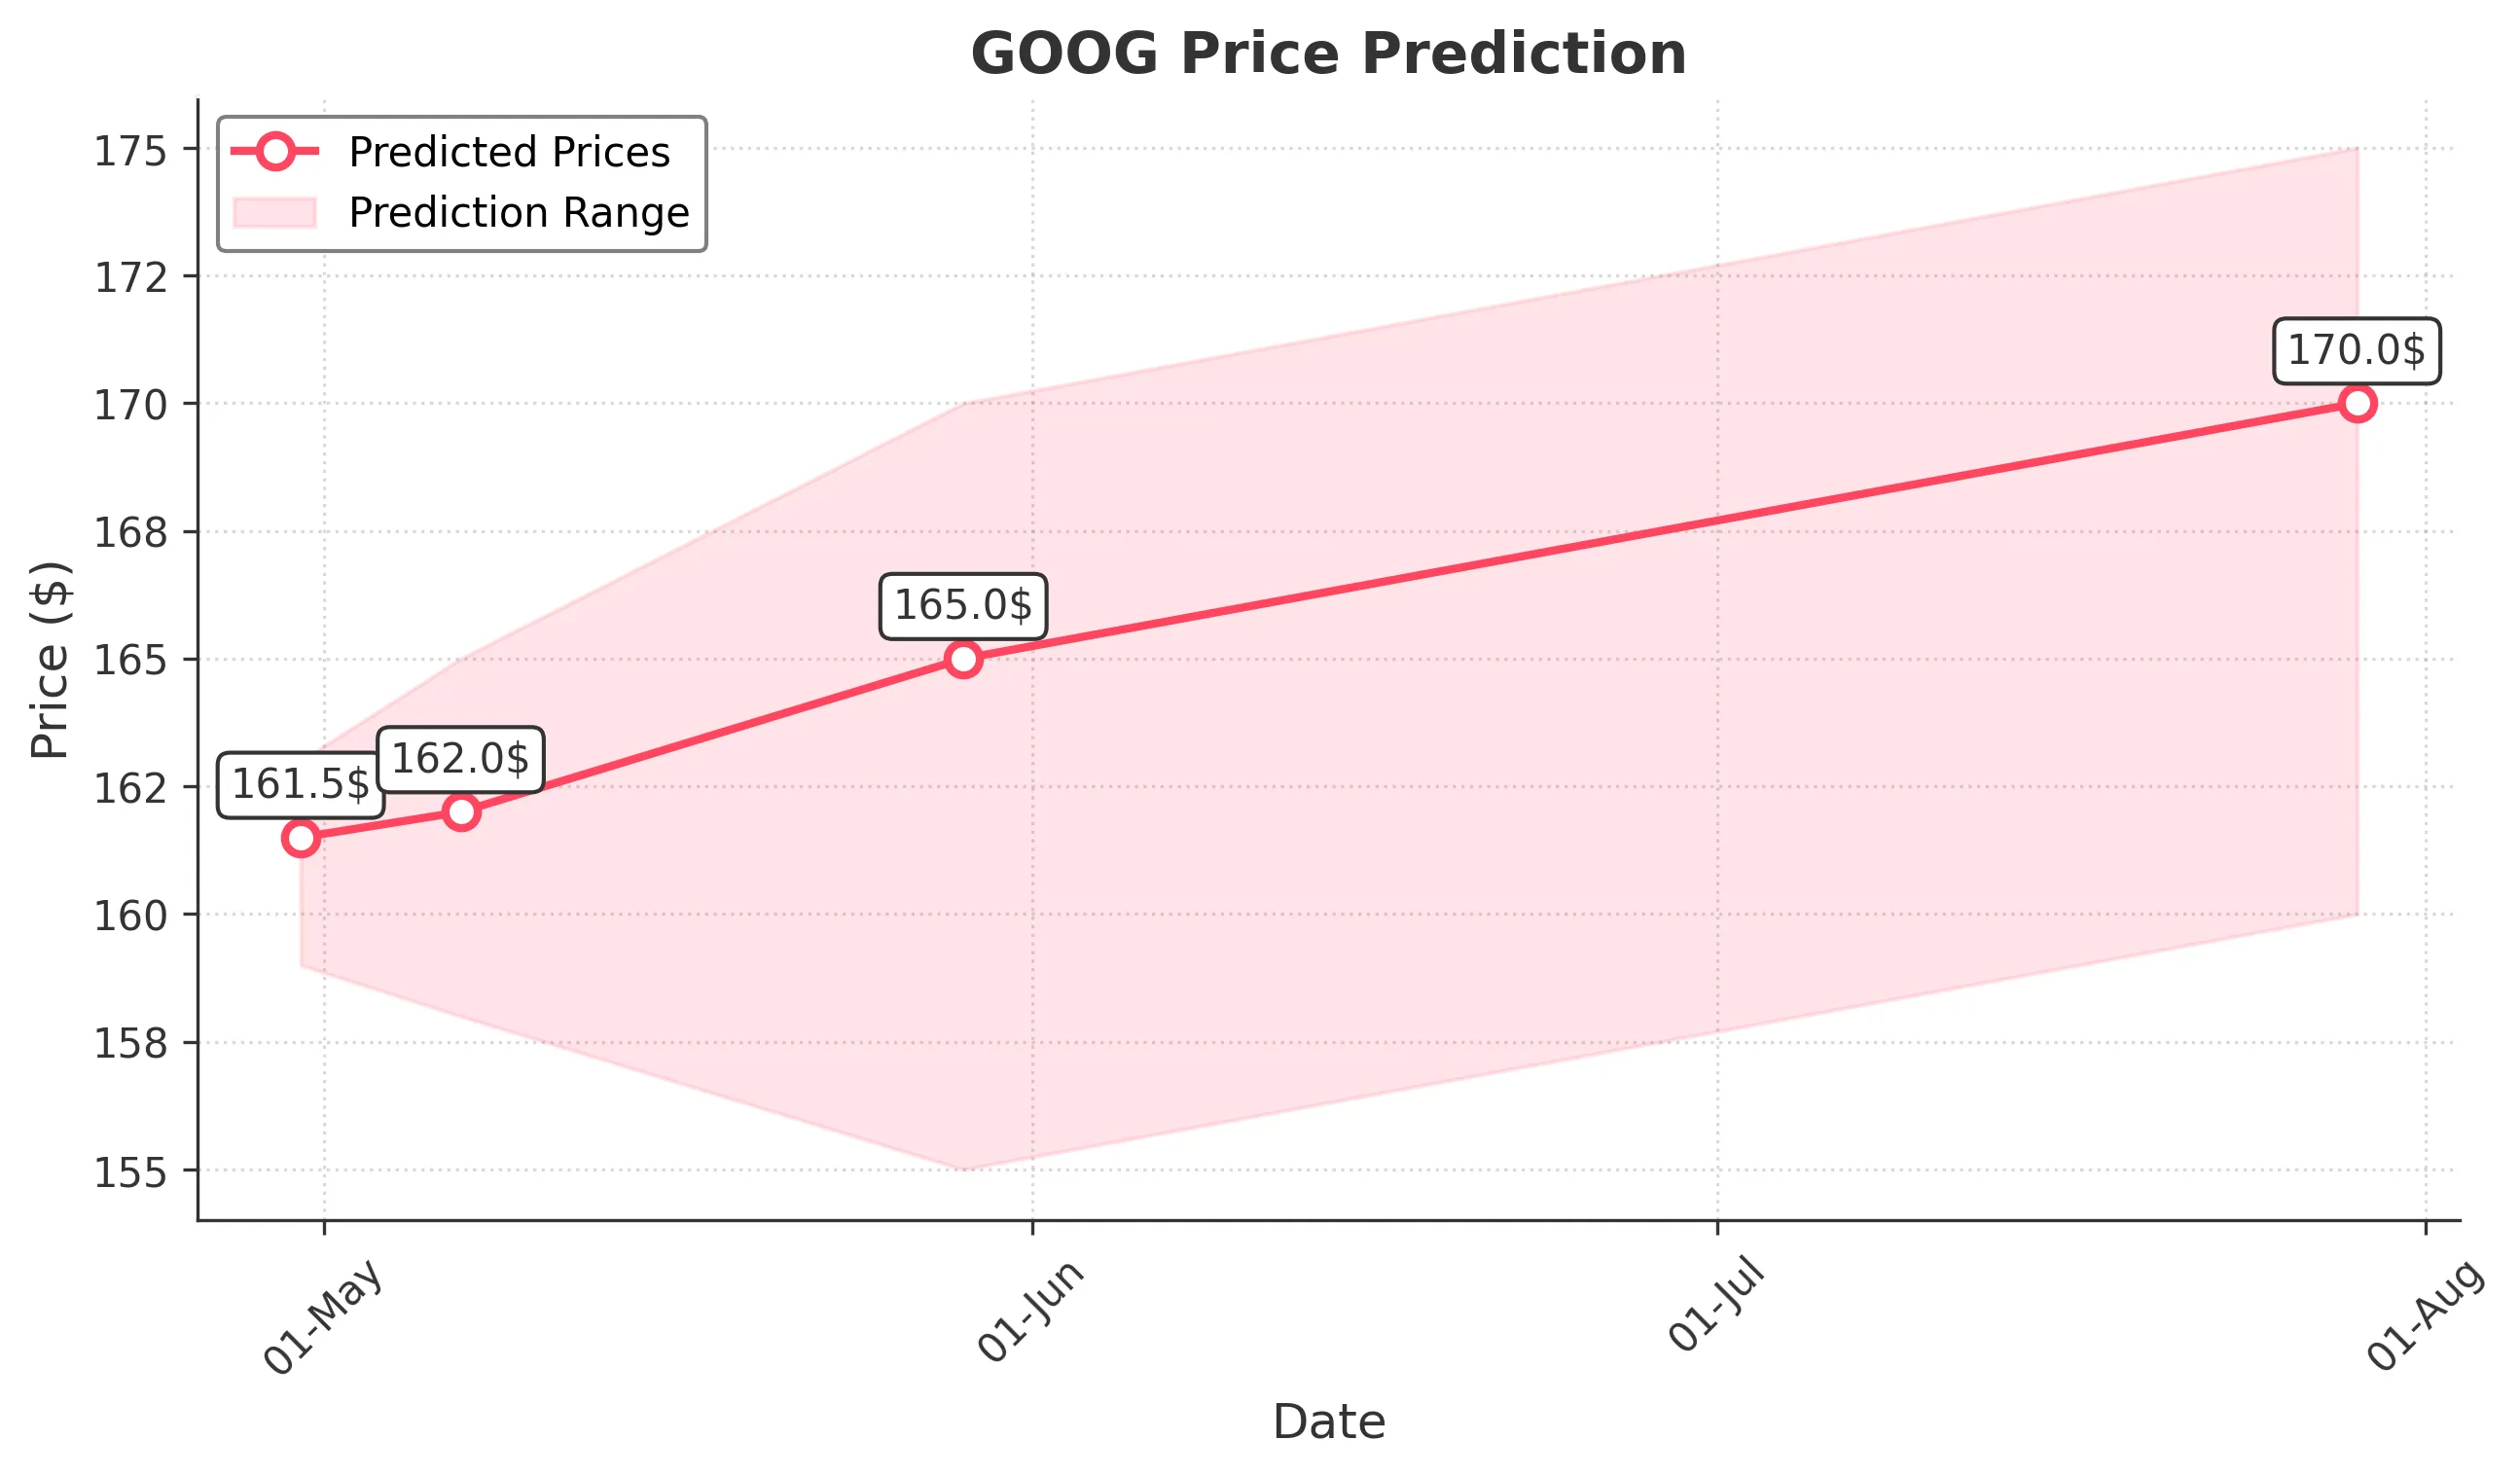
Target: April 30, 2025$161.5
$160.5
$163
$159
Description
The stock shows a slight bullish trend with a potential bounce from recent lows. RSI indicates oversold conditions, while MACD is showing a bullish crossover. However, volatility remains high, suggesting caution.
Analysis
GOOG has experienced a bearish trend over the past three months, with significant support around $160. Recent volume spikes indicate increased interest, but the overall trend remains uncertain. Technical indicators suggest potential for a short-term bounce.
Confidence Level
Potential Risks
Market sentiment could shift due to macroeconomic news or earnings reports, which may impact the prediction.
1 Week Prediction
Target: May 7, 2025$162
$161
$165
$158
Description
A potential recovery is indicated as the stock approaches key support levels. The Bollinger Bands suggest a tightening range, which may lead to a breakout. However, bearish sentiment persists, warranting caution.
Analysis
The stock has been in a downtrend, with resistance at $165. Technical indicators show mixed signals, with RSI near neutral. Volume patterns suggest accumulation, but overall market sentiment remains cautious.
Confidence Level
Potential Risks
Unforeseen market events or earnings surprises could lead to volatility, impacting the accuracy of this prediction.
1 Month Prediction
Target: May 29, 2025$165
$162
$170
$155
Description
Expect a gradual recovery as the stock tests resistance levels. The MACD shows potential bullish momentum, but the overall market environment remains volatile. Watch for external factors that could influence price.
Analysis
GOOG has faced significant selling pressure, with key support at $155. Technical indicators suggest a potential reversal, but the bearish trend remains a concern. Volume analysis indicates possible accumulation, but caution is advised.
Confidence Level
Potential Risks
Market volatility and external economic factors could lead to unexpected price movements.
3 Months Prediction
Target: July 29, 2025$170
$165
$175
$160
Description
A longer-term recovery is anticipated as the stock stabilizes. The Fibonacci retracement levels suggest potential upward movement, but macroeconomic factors could impact performance. Monitor for changes in market sentiment.
Analysis
The stock has been in a bearish phase, with significant resistance at $175. Technical indicators show signs of potential recovery, but overall market conditions remain uncertain. Volume patterns indicate mixed sentiment, suggesting caution.
Confidence Level
Potential Risks
Economic conditions and market sentiment could lead to fluctuations, affecting the prediction's accuracy.