GOOG Trading Predictions
1 Day Prediction
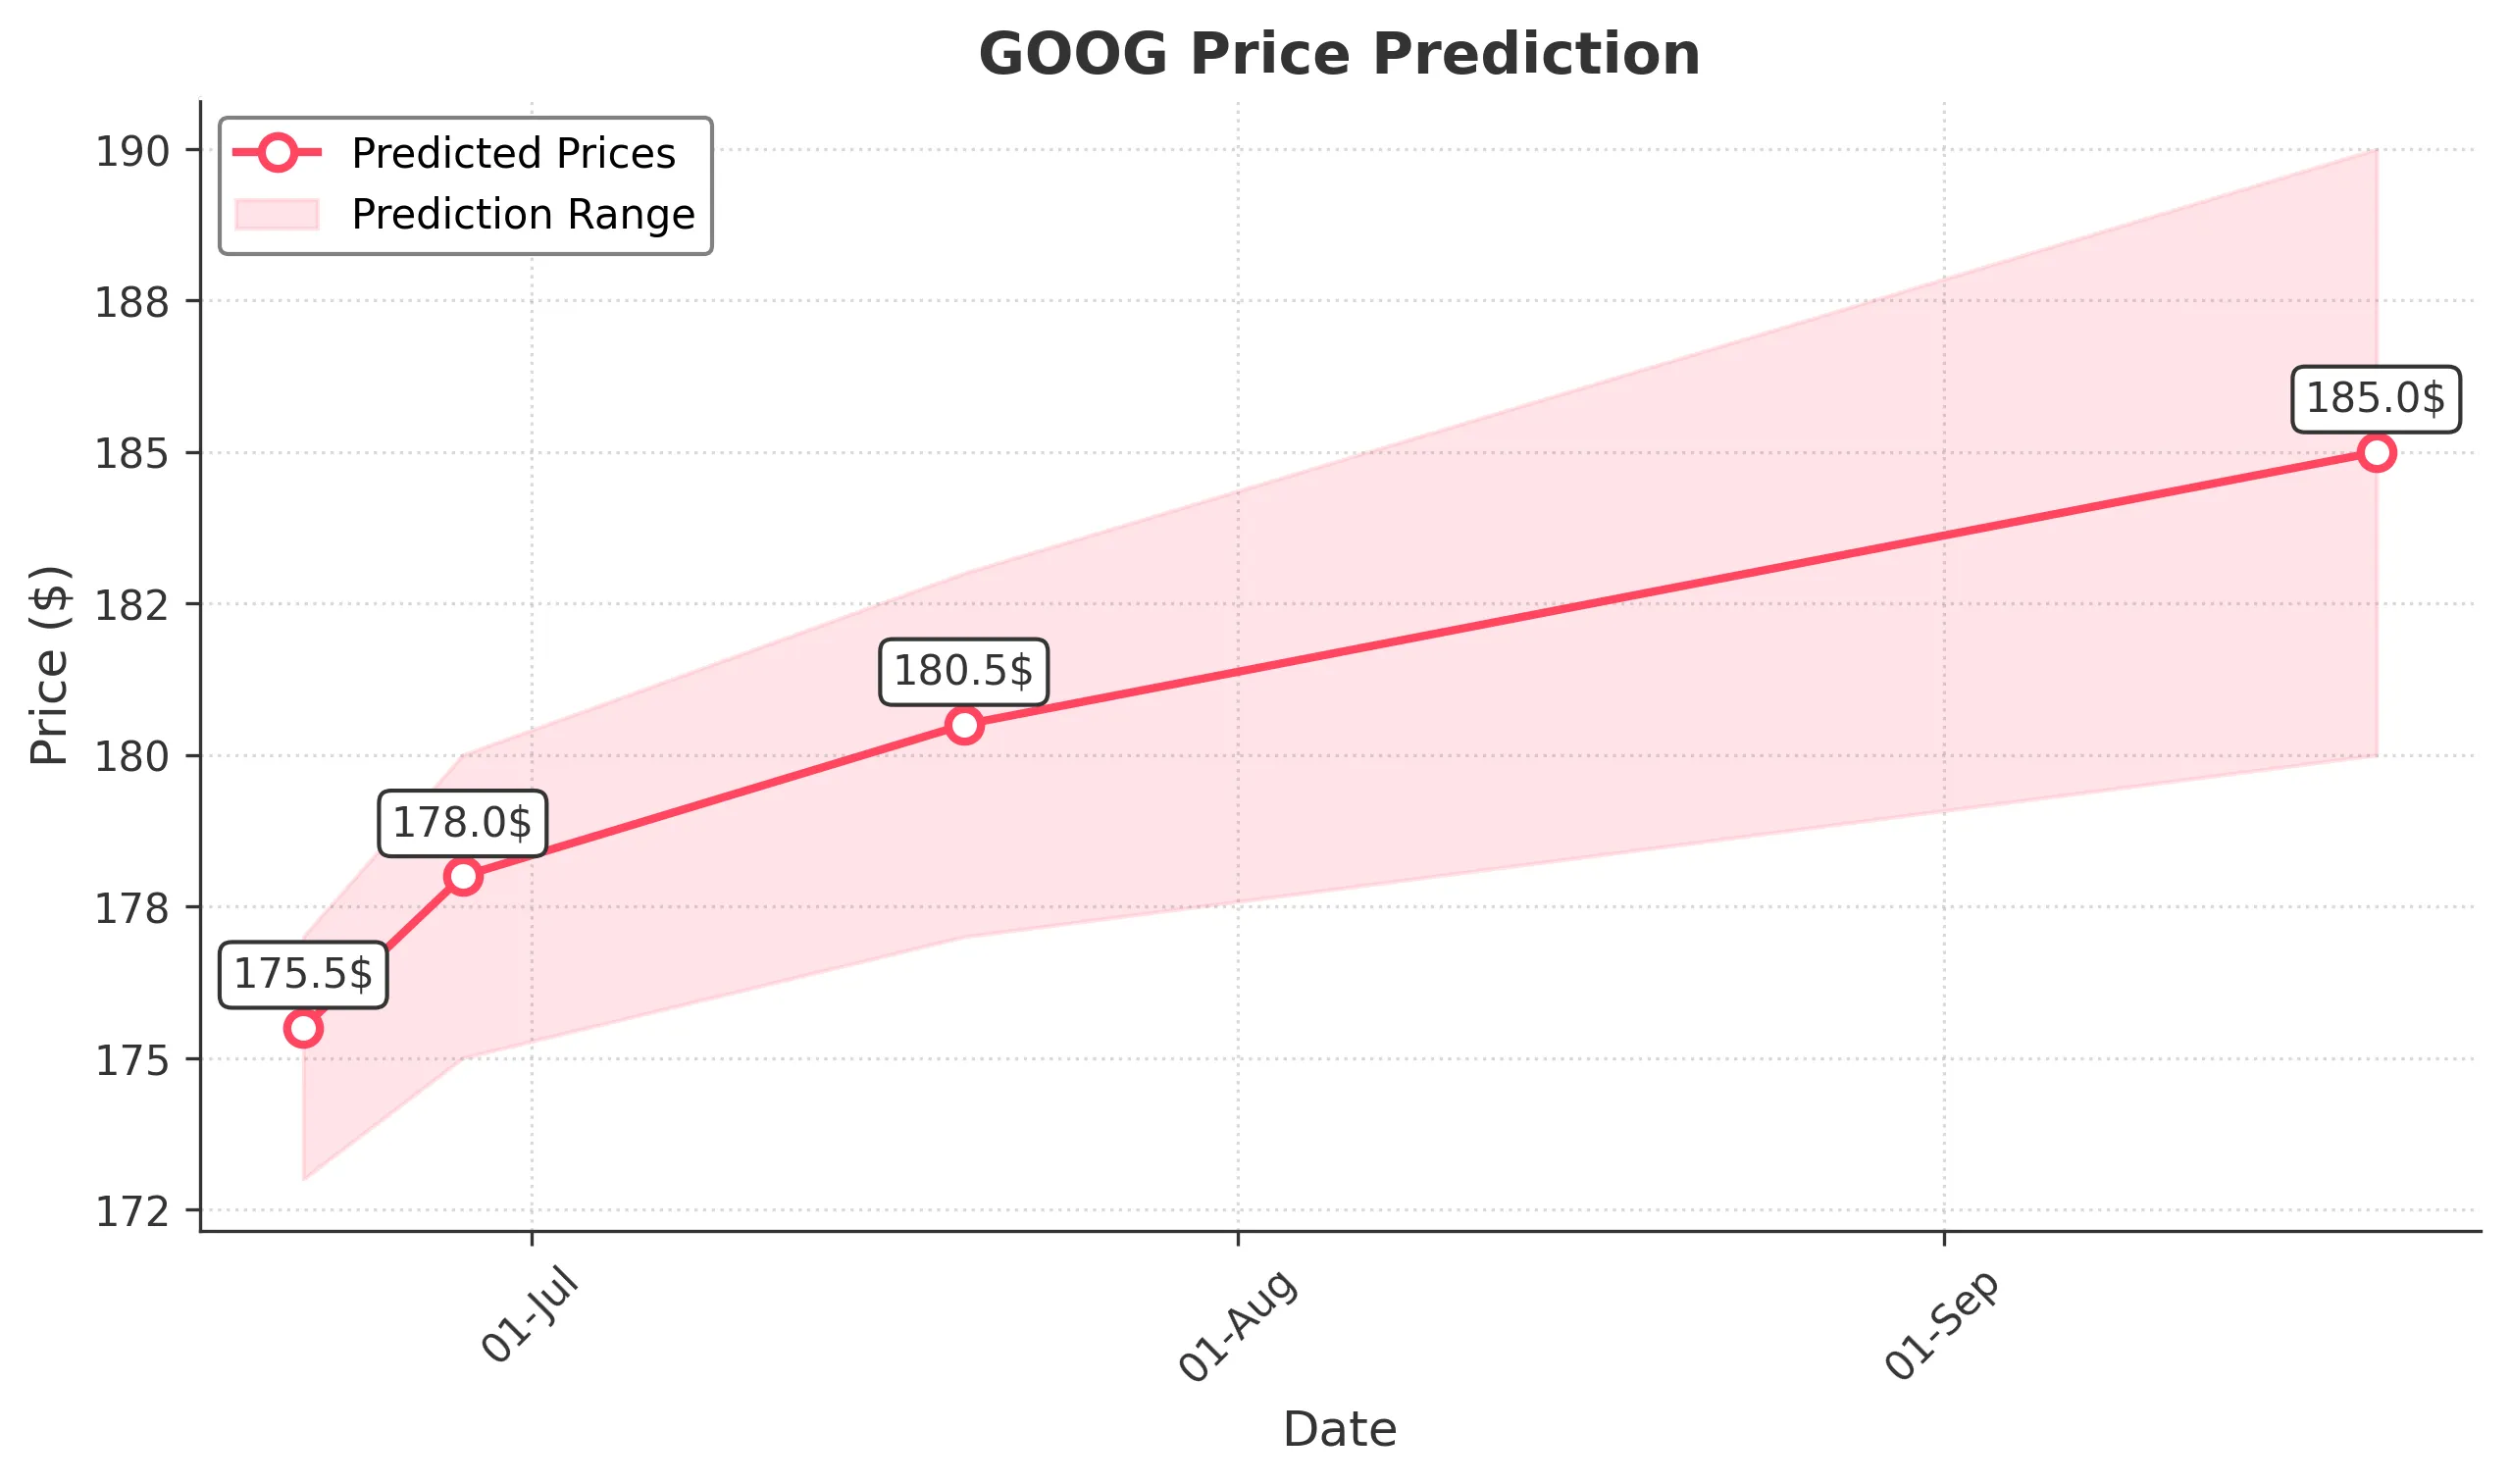
Target: June 21, 2025$175.5
$174.5
$177
$173
Description
The stock shows a slight bullish trend with a recent Doji pattern indicating indecision. RSI is neutral, and MACD is close to crossing above the signal line. Expecting a minor upward movement with potential resistance at 177.
Analysis
GOOG has shown a mixed performance over the past 3 months, with key support at 173 and resistance at 177. Recent volume spikes suggest increased interest, but the overall trend remains cautious.
Confidence Level
Potential Risks
Market volatility and external news could impact the price. A bearish reversal is possible if the support at 173 fails.
1 Week Prediction
Target: June 28, 2025$178
$176.5
$180
$175
Description
With a bullish engulfing pattern forming, the stock is likely to continue its upward trajectory. The MACD is bullish, and the RSI is approaching overbought territory, indicating strong momentum.
Analysis
The stock has been trending upward, with strong support at 175. The recent bullish patterns and positive volume suggest a continuation of this trend, but caution is advised as the RSI nears overbought levels.
Confidence Level
Potential Risks
Potential market corrections or negative news could reverse the trend. Watch for any significant changes in volume.
1 Month Prediction
Target: July 20, 2025$180.5
$179
$183
$177
Description
The stock is expected to maintain its bullish momentum, supported by strong fundamentals and positive market sentiment. Fibonacci retracement levels indicate potential resistance at 183.
Analysis
GOOG has shown resilience with a bullish trend. Key support at 177 and resistance at 183 are critical. The overall market sentiment remains positive, but external factors could influence performance.
Confidence Level
Potential Risks
Economic indicators and earnings reports could introduce volatility. A failure to break above 183 may lead to a pullback.
3 Months Prediction
Target: September 20, 2025$185
$182
$190
$180
Description
Long-term indicators suggest a bullish trend, with MACD and RSI supporting upward movement. However, potential resistance at 190 could limit gains.
Analysis
Over the past 3 months, GOOG has shown a bullish trend with significant support at 180. The stock's performance is influenced by broader market trends and economic indicators, which could introduce risks.
Confidence Level
Potential Risks
Market conditions and macroeconomic factors could lead to unexpected volatility. A bearish trend could emerge if key support levels are breached.