GOOG Trading Predictions
1 Day Prediction
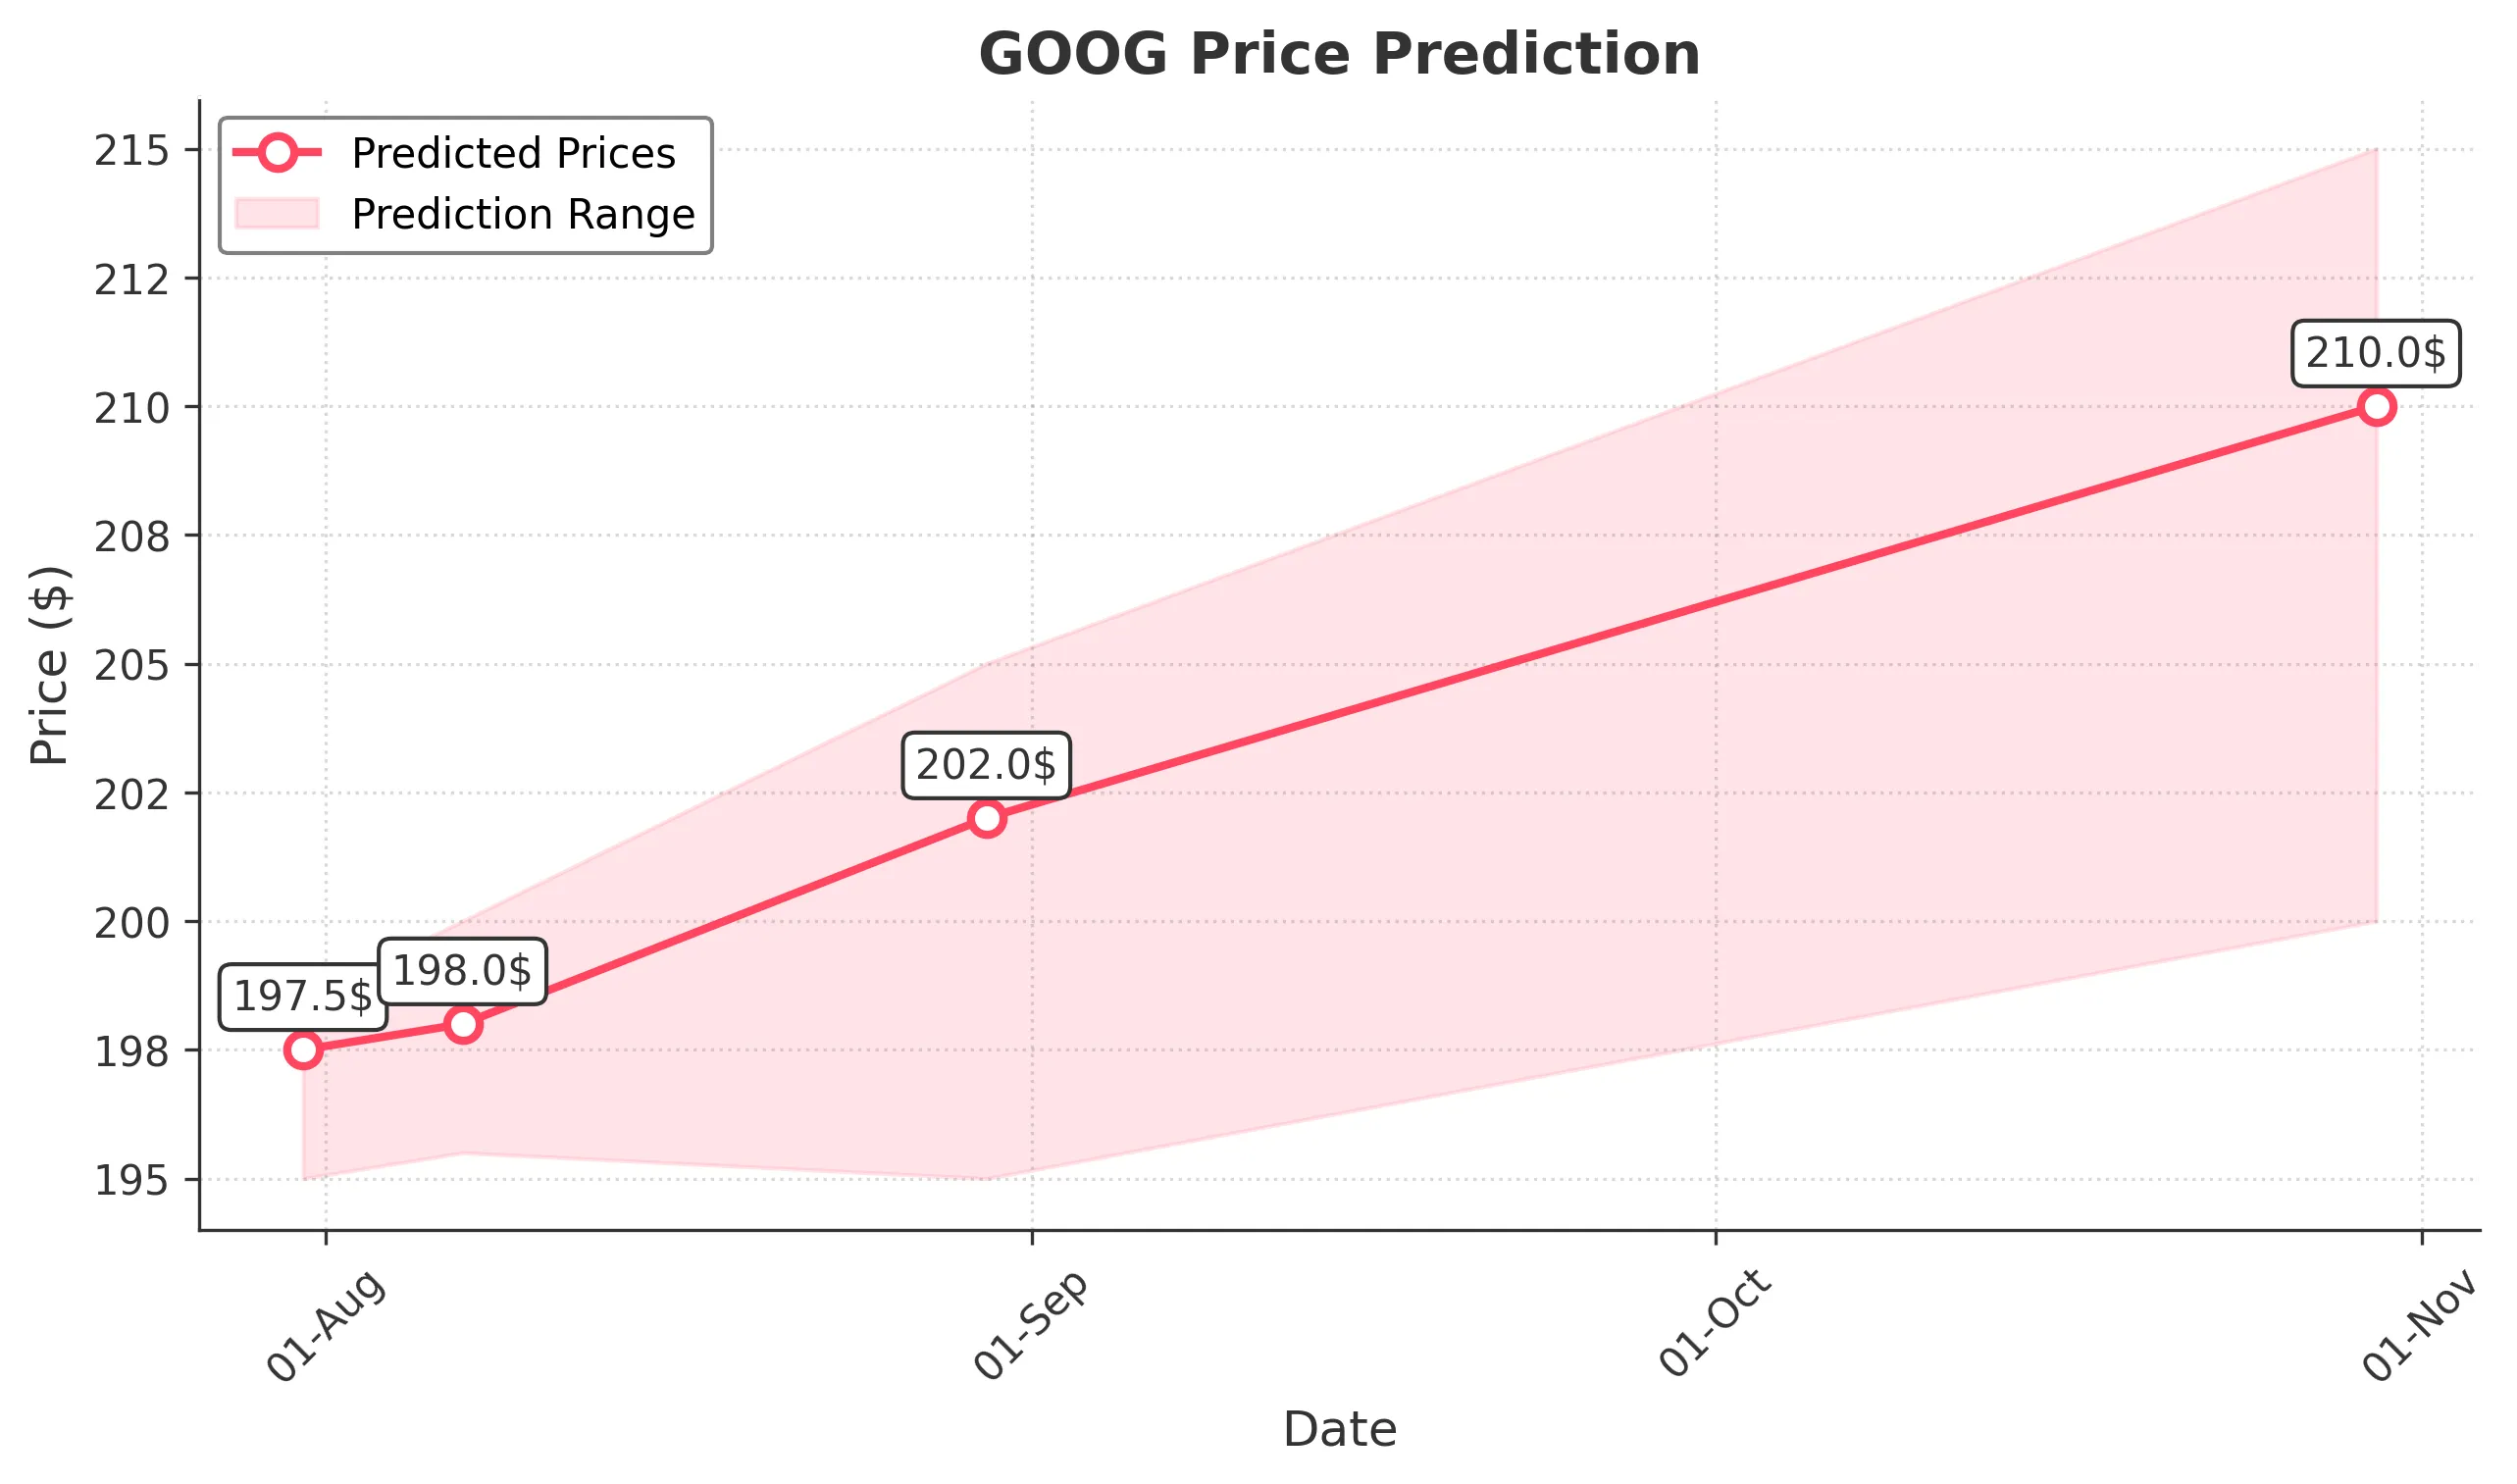
Target: July 31, 2025$197.5
$196.8
$198.5
$195
Description
The stock shows bullish momentum with a recent upward trend. The RSI is approaching overbought levels, indicating potential for a pullback. However, strong support at $196 and resistance at $198 suggest a tight range. Volume remains healthy, supporting the upward movement.
Analysis
GOOG has shown a bullish trend over the past three months, with significant support at $196 and resistance at $198. The recent price action indicates strong buying interest, but the RSI nearing overbought levels suggests caution. Volume patterns indicate healthy trading activity, but external market factors could introduce volatility.
Confidence Level
Potential Risks
Potential market volatility and profit-taking could lead to a pullback, affecting the prediction.
1 Week Prediction
Target: August 7, 2025$198
$197
$200
$195.5
Description
The bullish trend is expected to continue, with the stock likely to test the $200 resistance level. The MACD is showing positive momentum, and the Bollinger Bands indicate potential for upward movement. However, the RSI suggests caution as it approaches overbought territory.
Analysis
GOOG has maintained a bullish trend, with key support at $196 and resistance at $200. The MACD indicates positive momentum, while the RSI suggests potential overbought conditions. Volume analysis shows consistent buying interest, but external factors could introduce volatility.
Confidence Level
Potential Risks
Market sentiment could shift due to macroeconomic news, impacting the stock's performance.
1 Month Prediction
Target: August 30, 2025$202
$200.5
$205
$195
Description
The stock is expected to continue its upward trajectory, potentially reaching $202. The Fibonacci retracement levels support this bullish outlook, while the MACD remains positive. However, the RSI indicates overbought conditions, suggesting a possible correction.
Analysis
GOOG has shown a strong bullish trend, with significant support at $196 and resistance at $205. The MACD and Fibonacci levels support further upward movement, but the RSI indicates potential overbought conditions. Volume patterns suggest healthy trading, but external factors could introduce risks.
Confidence Level
Potential Risks
Unforeseen market events or earnings reports could lead to volatility and impact the prediction.
3 Months Prediction
Target: October 30, 2025$210
$205
$215
$200
Description
The stock is projected to reach $210, driven by strong fundamentals and market sentiment. The long-term trend remains bullish, supported by positive earnings outlooks. However, potential market corrections and economic factors could introduce volatility.
Analysis
GOOG has shown a consistent bullish trend, with key support at $200 and resistance at $215. The overall market sentiment is positive, but potential economic uncertainties could lead to volatility. The stock's performance will depend on macroeconomic factors and earnings reports in the coming months.
Confidence Level
Potential Risks
Economic downturns or negative news could significantly impact stock performance, leading to potential declines.