HGF Trading Predictions
1 Day Prediction
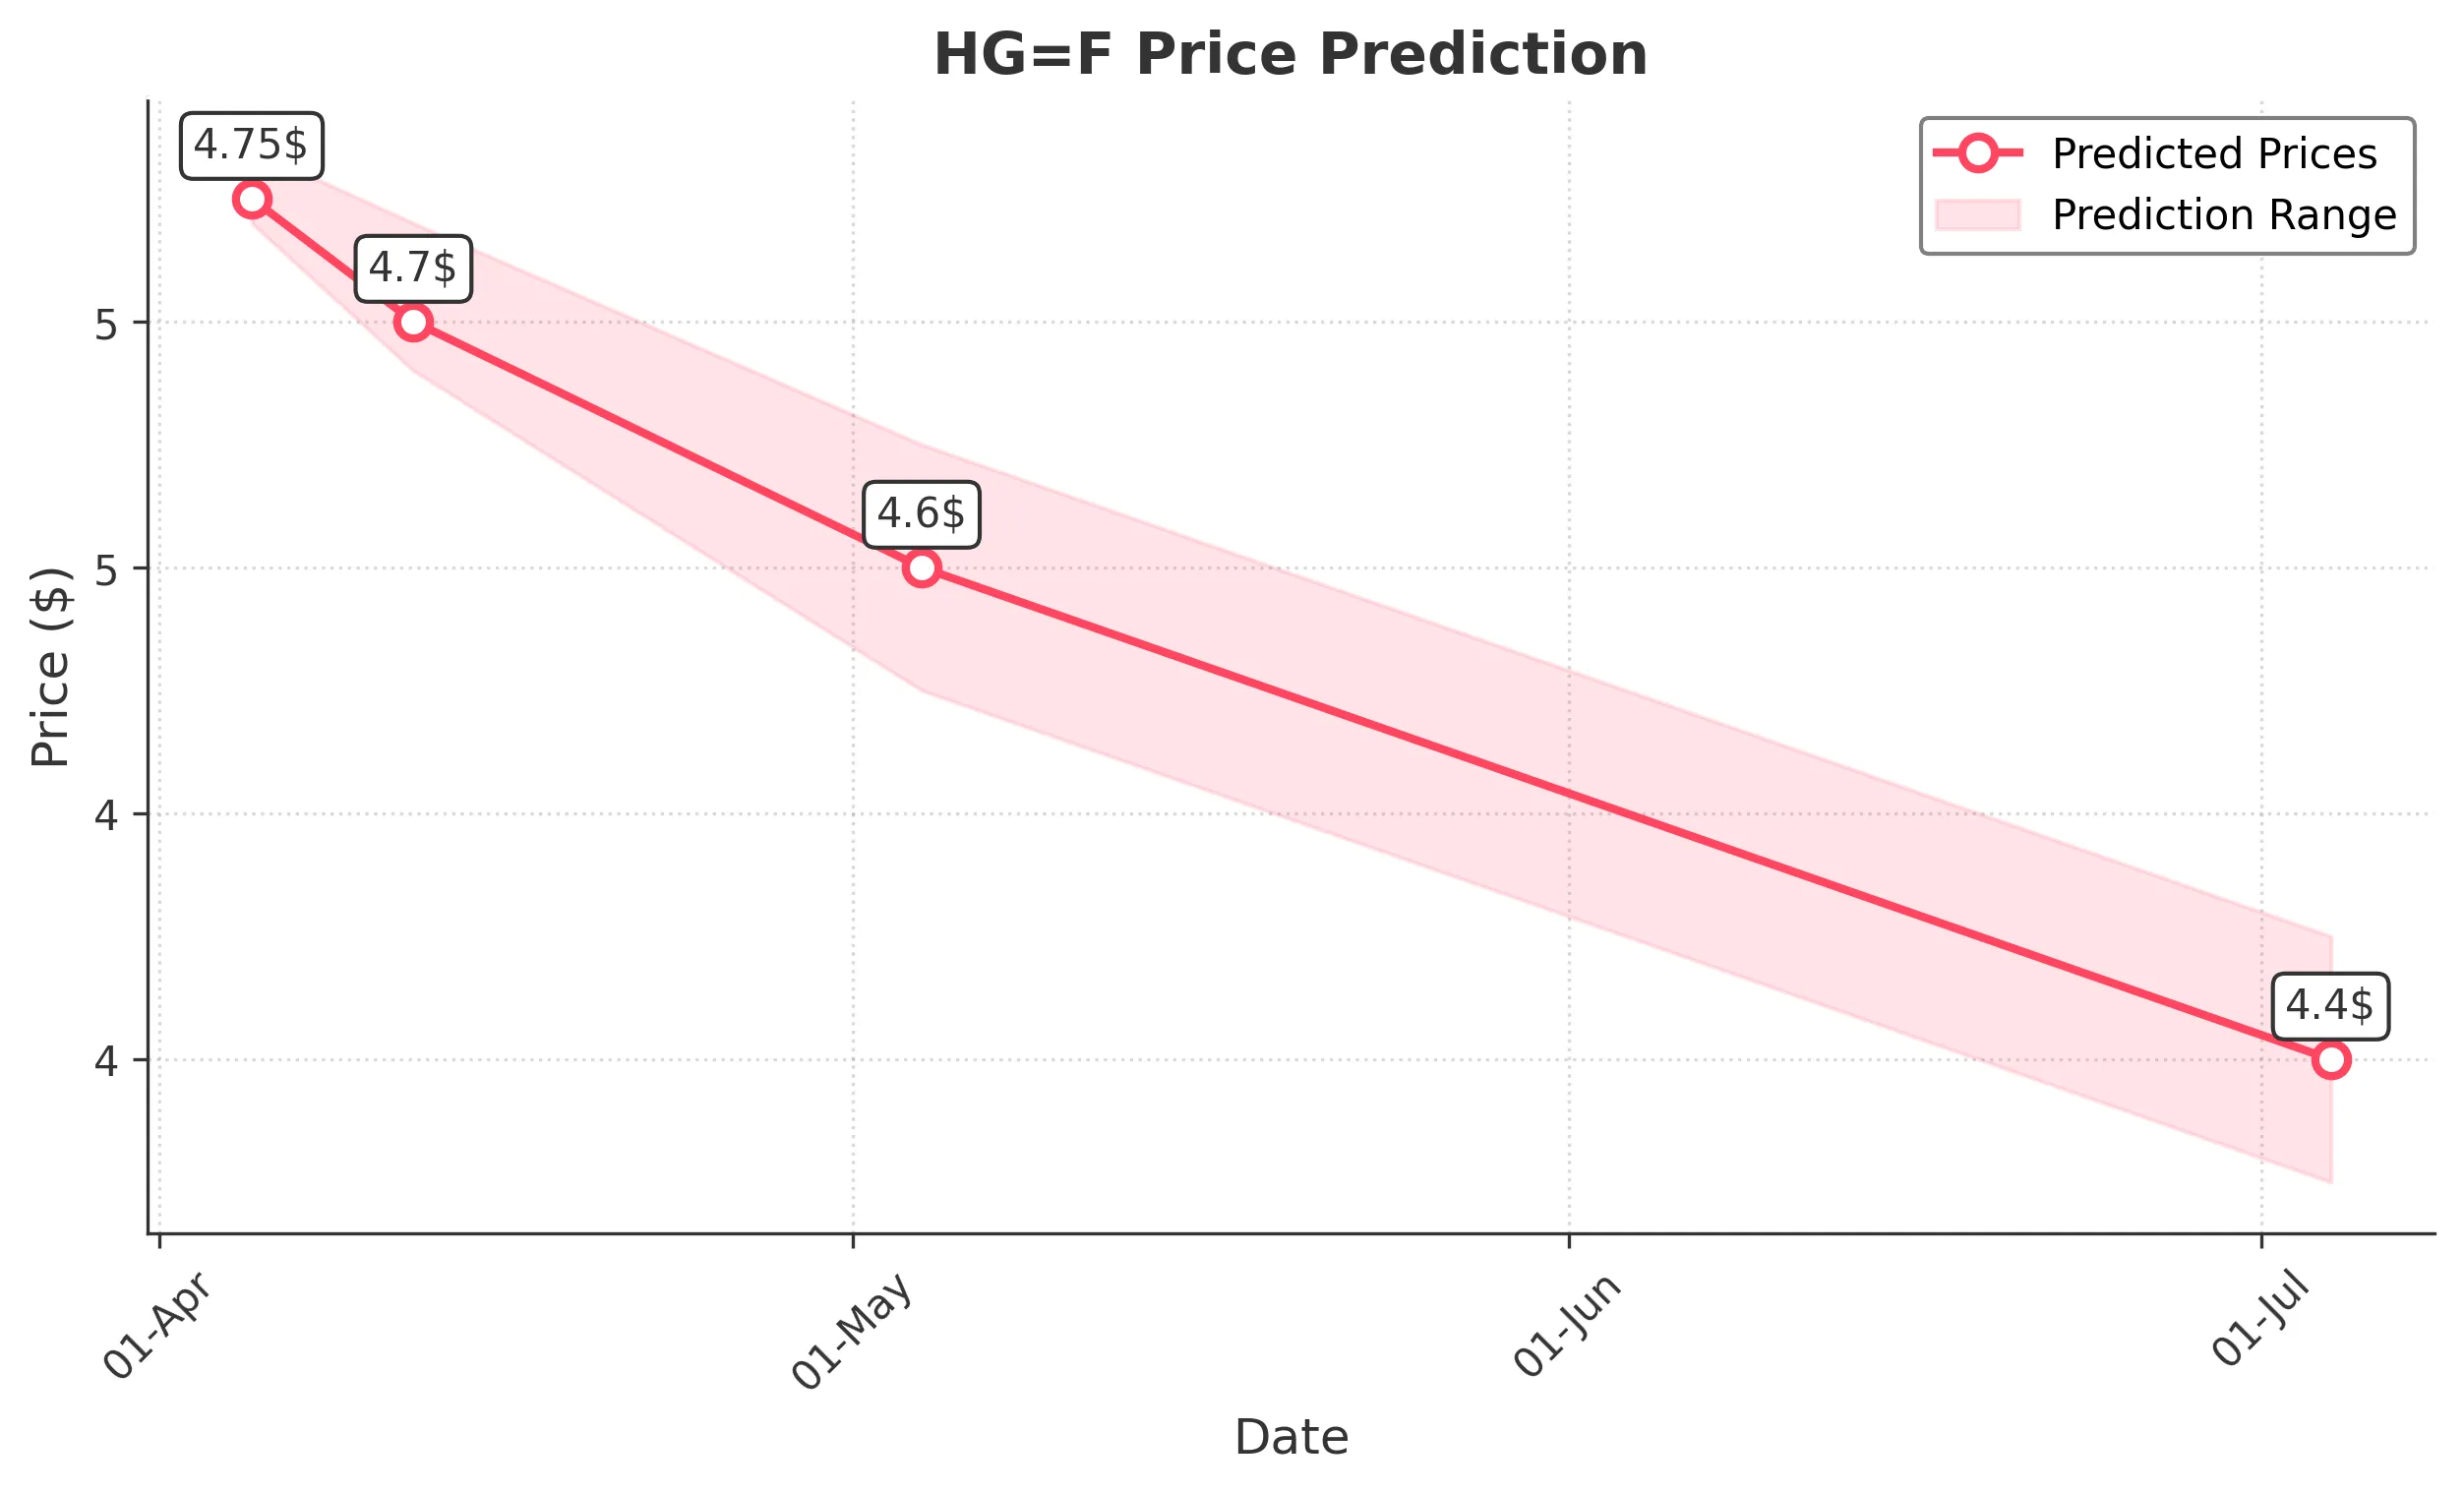
Target: April 5, 2025$4.75
$4.7715
$4.77
$4.74
Description
The stock shows a slight bearish trend with a recent close below the 20-day moving average. RSI indicates overbought conditions, suggesting a potential pullback. Volume is expected to increase as traders react to recent price movements.
Analysis
Over the past 3 months, HG=F has shown a bullish trend with significant upward movement, peaking at 5.1830. However, recent price action indicates a potential reversal, with support at 4.7400 and resistance at 5.1000. Volume spikes on down days suggest selling pressure.
Confidence Level
Potential Risks
Market volatility and external news could impact the prediction. A sudden bullish sentiment could reverse the trend.
1 Week Prediction
Target: April 12, 2025$4.7
$4.75
$4.74
$4.68
Description
The stock is likely to continue its bearish trend, with resistance at 4.7700. The MACD shows a bearish crossover, and the RSI is approaching oversold territory, indicating potential for a bounce but overall weakness.
Analysis
The stock has been in a corrective phase after reaching highs in March. Key support at 4.6800 is critical, while the recent bearish candlestick patterns suggest further downside risk. Volume analysis indicates a lack of strong buying interest.
Confidence Level
Potential Risks
Unforeseen macroeconomic events or earnings reports could lead to volatility, impacting the accuracy of this prediction.
1 Month Prediction
Target: May 4, 2025$4.6
$4.7
$4.65
$4.55
Description
The stock is expected to trend lower as bearish sentiment persists. Fibonacci retracement levels suggest a target around 4.6000, with potential for further declines if support levels fail.
Analysis
The stock has shown significant volatility, with recent highs followed by sharp declines. The 50-day moving average is trending down, indicating a bearish outlook. Support at 4.6000 is crucial, and failure to hold this level could lead to further declines.
Confidence Level
Potential Risks
Market sentiment can shift rapidly, and any positive news could lead to a reversal. The overall economic environment remains uncertain.
3 Months Prediction
Target: July 4, 2025$4.4
$4.6
$4.45
$4.35
Description
The stock is likely to continue its downward trend, with macroeconomic factors weighing heavily. A bearish divergence in the RSI suggests weakening momentum, and further declines are expected.
Analysis
Over the past three months, HG=F has experienced significant fluctuations, with a clear bearish trend emerging. Key resistance levels are being tested, and if they fail, the stock could see further declines. External economic factors will play a crucial role in future performance.
Confidence Level
Potential Risks
Long-term predictions are highly uncertain due to potential market shifts and economic changes. A recovery could occur if market conditions improve.