HGF Trading Predictions
1 Day Prediction
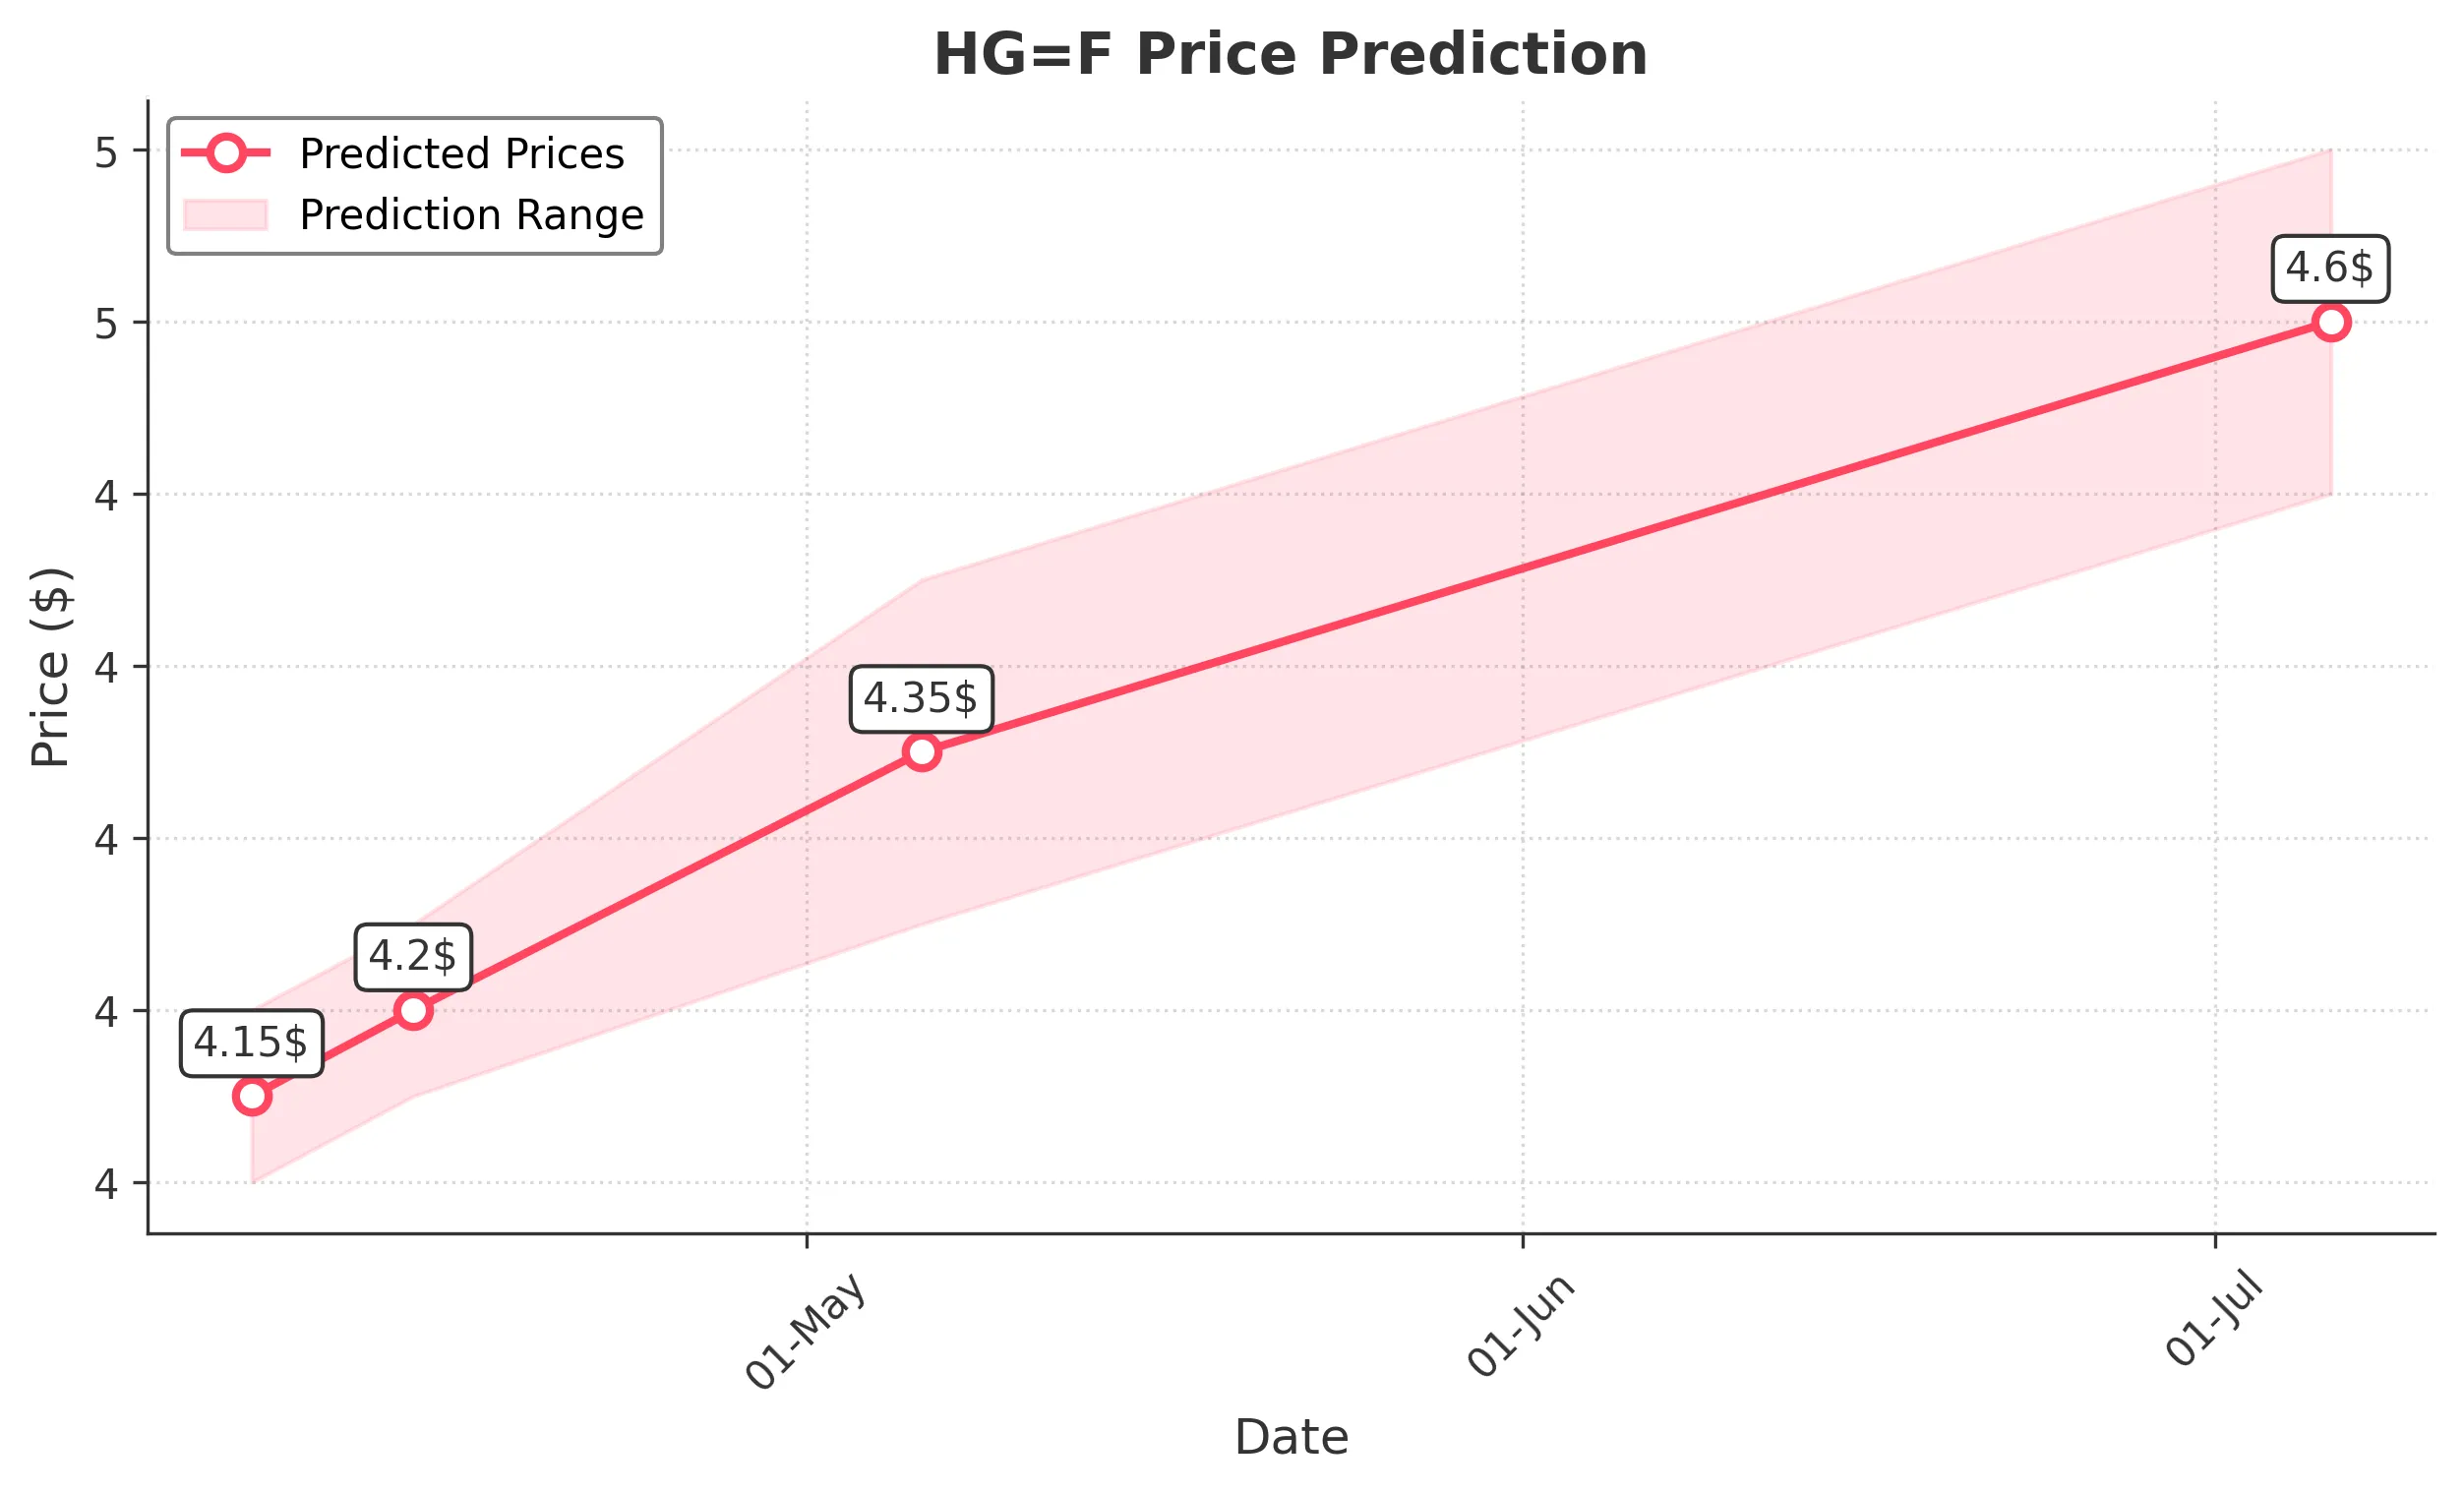
Target: April 7, 2025$4.15
$4.13
$4.2
$4.1
Description
The stock shows a slight bullish trend with a potential recovery from recent lows. RSI indicates oversold conditions, while MACD is showing a bullish crossover. However, volatility remains high, suggesting caution.
Analysis
Over the past 3 months, HG=F has shown a bearish trend with significant fluctuations. Key support at 4.10 and resistance at 5.10. Recent volume spikes indicate increased interest, but overall sentiment remains cautious.
Confidence Level
Potential Risks
Market sentiment could shift due to macroeconomic news or earnings reports, which may impact the stock's performance.
1 Week Prediction
Target: April 14, 2025$4.2
$4.18
$4.25
$4.15
Description
A potential upward movement is expected as the stock may find support at 4.10. The RSI is recovering, and MACD shows bullish momentum. However, external factors could lead to volatility.
Analysis
The stock has been volatile, with recent bearish movements. Key resistance at 5.10 and support at 4.10. Volume analysis shows increased trading activity, indicating potential interest from investors.
Confidence Level
Potential Risks
Unforeseen market events or economic data releases could reverse the trend, impacting the prediction.
1 Month Prediction
Target: May 6, 2025$4.35
$4.3
$4.45
$4.25
Description
The stock is expected to recover gradually, supported by bullish indicators. The MACD is showing positive divergence, and the RSI is stabilizing. However, market conditions remain uncertain.
Analysis
The past three months have shown a bearish trend with significant price fluctuations. Key support at 4.10 and resistance at 5.10. Volume patterns indicate mixed investor sentiment, with potential for recovery if conditions improve.
Confidence Level
Potential Risks
Potential economic downturns or changes in market sentiment could hinder recovery, leading to unexpected price movements.
3 Months Prediction
Target: July 6, 2025$4.6
$4.55
$4.7
$4.5
Description
A bullish trend is anticipated as the stock may stabilize and recover. The MACD indicates a potential upward trend, and the RSI is moving towards neutral. However, external economic factors could impact this outlook.
Analysis
The stock has experienced significant volatility, with a bearish trend recently. Key resistance at 5.10 and support at 4.10. Volume analysis shows mixed signals, indicating uncertainty in market sentiment.
Confidence Level
Potential Risks
Economic uncertainties and market volatility could lead to unexpected price movements, affecting the accuracy of this prediction.