HGF Trading Predictions
1 Day Prediction
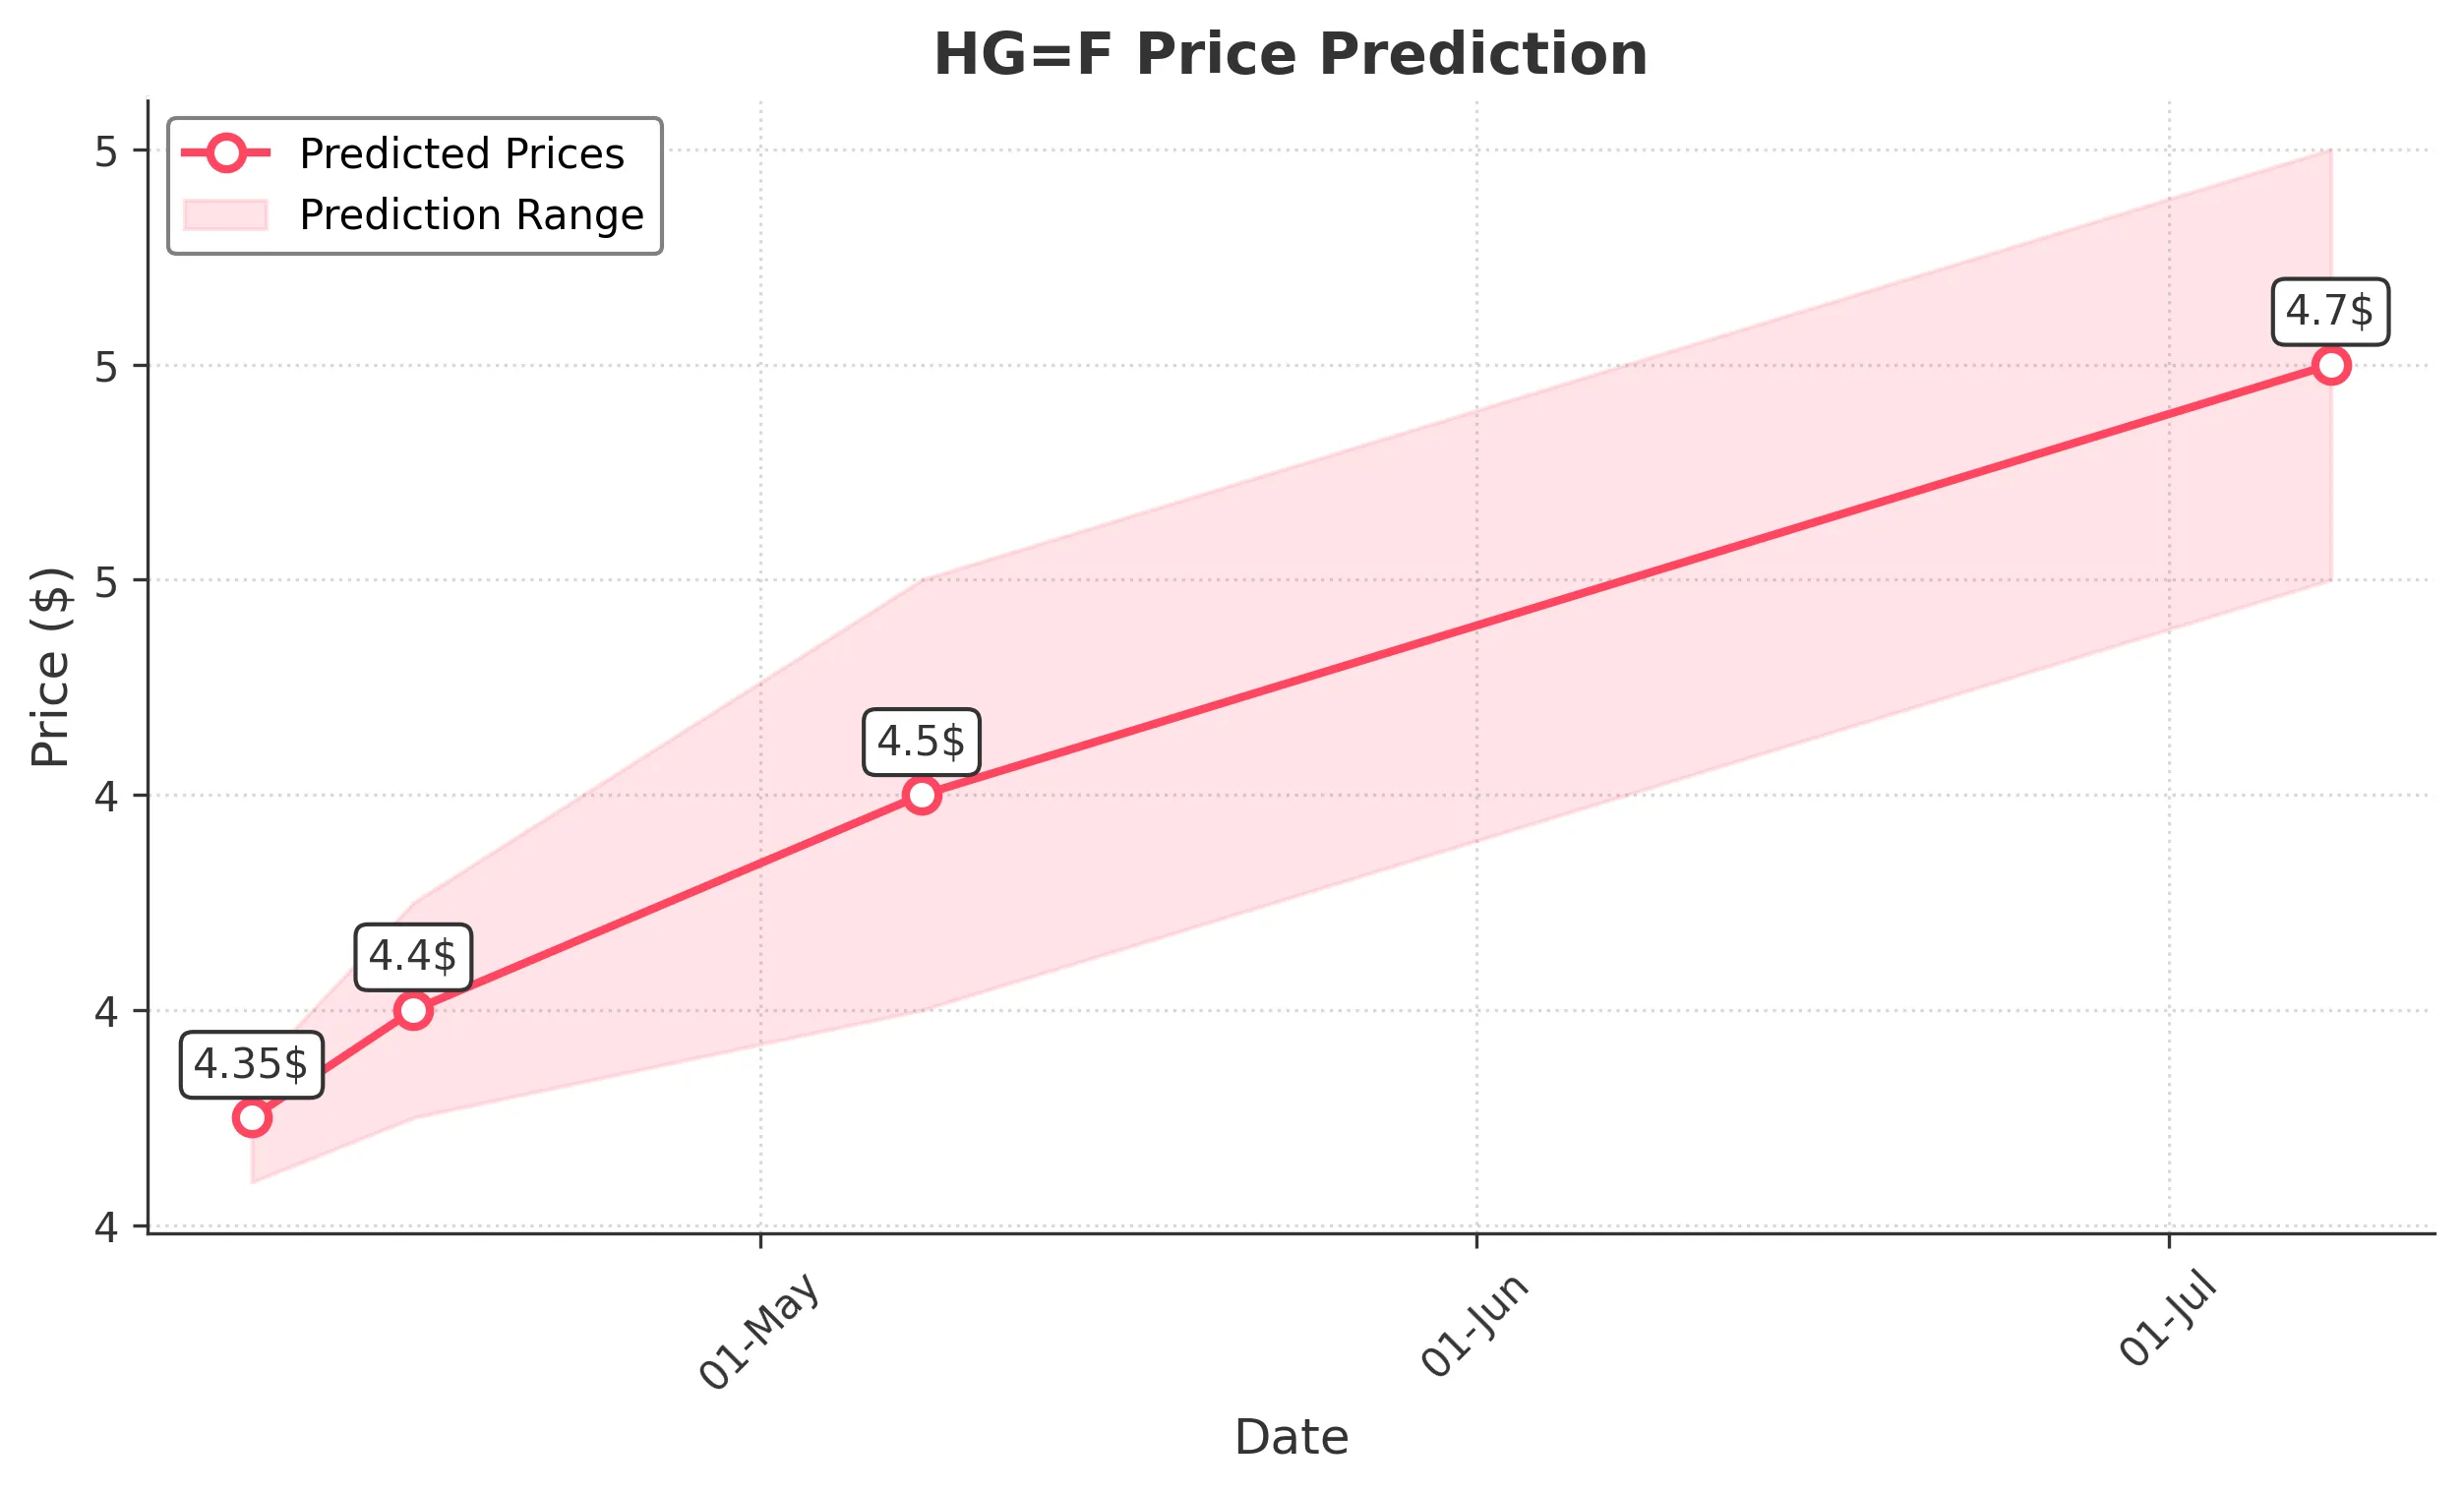
Target: April 9, 2025$4.35
$4.34
$4.37
$4.32
Description
The stock shows a slight bullish trend with a recent Doji pattern indicating indecision. The RSI is near 50, suggesting a potential upward move. However, recent volatility and lower volume may limit gains.
Analysis
Over the past 3 months, HG=F has shown a bullish trend with significant resistance around 5.10. Recent price action indicates a pullback, with support at 4.15. The MACD is bullish, but the ATR suggests increased volatility.
Confidence Level
Potential Risks
Market sentiment is mixed, and external factors could lead to sudden price changes.
1 Week Prediction
Target: April 16, 2025$4.4
$4.37
$4.45
$4.35
Description
The stock is expected to recover slightly as the MACD shows bullish momentum. The RSI is improving, indicating potential upward movement. However, resistance at 4.50 may limit gains.
Analysis
The stock has been in a consolidation phase, with key support at 4.15 and resistance at 5.10. Recent volume spikes suggest increased interest, but the overall trend remains cautious.
Confidence Level
Potential Risks
Potential market corrections and external economic factors could impact the price.
1 Month Prediction
Target: May 8, 2025$4.5
$4.45
$4.6
$4.4
Description
A gradual upward trend is anticipated as the stock approaches key Fibonacci retracement levels. The RSI is expected to remain bullish, but market volatility could pose risks.
Analysis
The stock has shown resilience with a bullish trend, but recent price action indicates potential resistance at 4.60. The MACD is bullish, and volume patterns suggest growing interest.
Confidence Level
Potential Risks
Economic data releases and geopolitical events may introduce uncertainty.
3 Months Prediction
Target: July 8, 2025$4.7
$4.65
$4.8
$4.6
Description
Long-term bullish sentiment is expected as the stock approaches historical highs. The MACD and RSI indicate strong momentum, but overbought conditions may lead to corrections.
Analysis
The stock has been on a bullish trajectory, with significant support at 4.15 and resistance at 5.10. The overall market sentiment is positive, but caution is advised due to potential volatility.
Confidence Level
Potential Risks
Market corrections and external economic factors could impact the price trajectory.