HGF Trading Predictions
1 Day Prediction
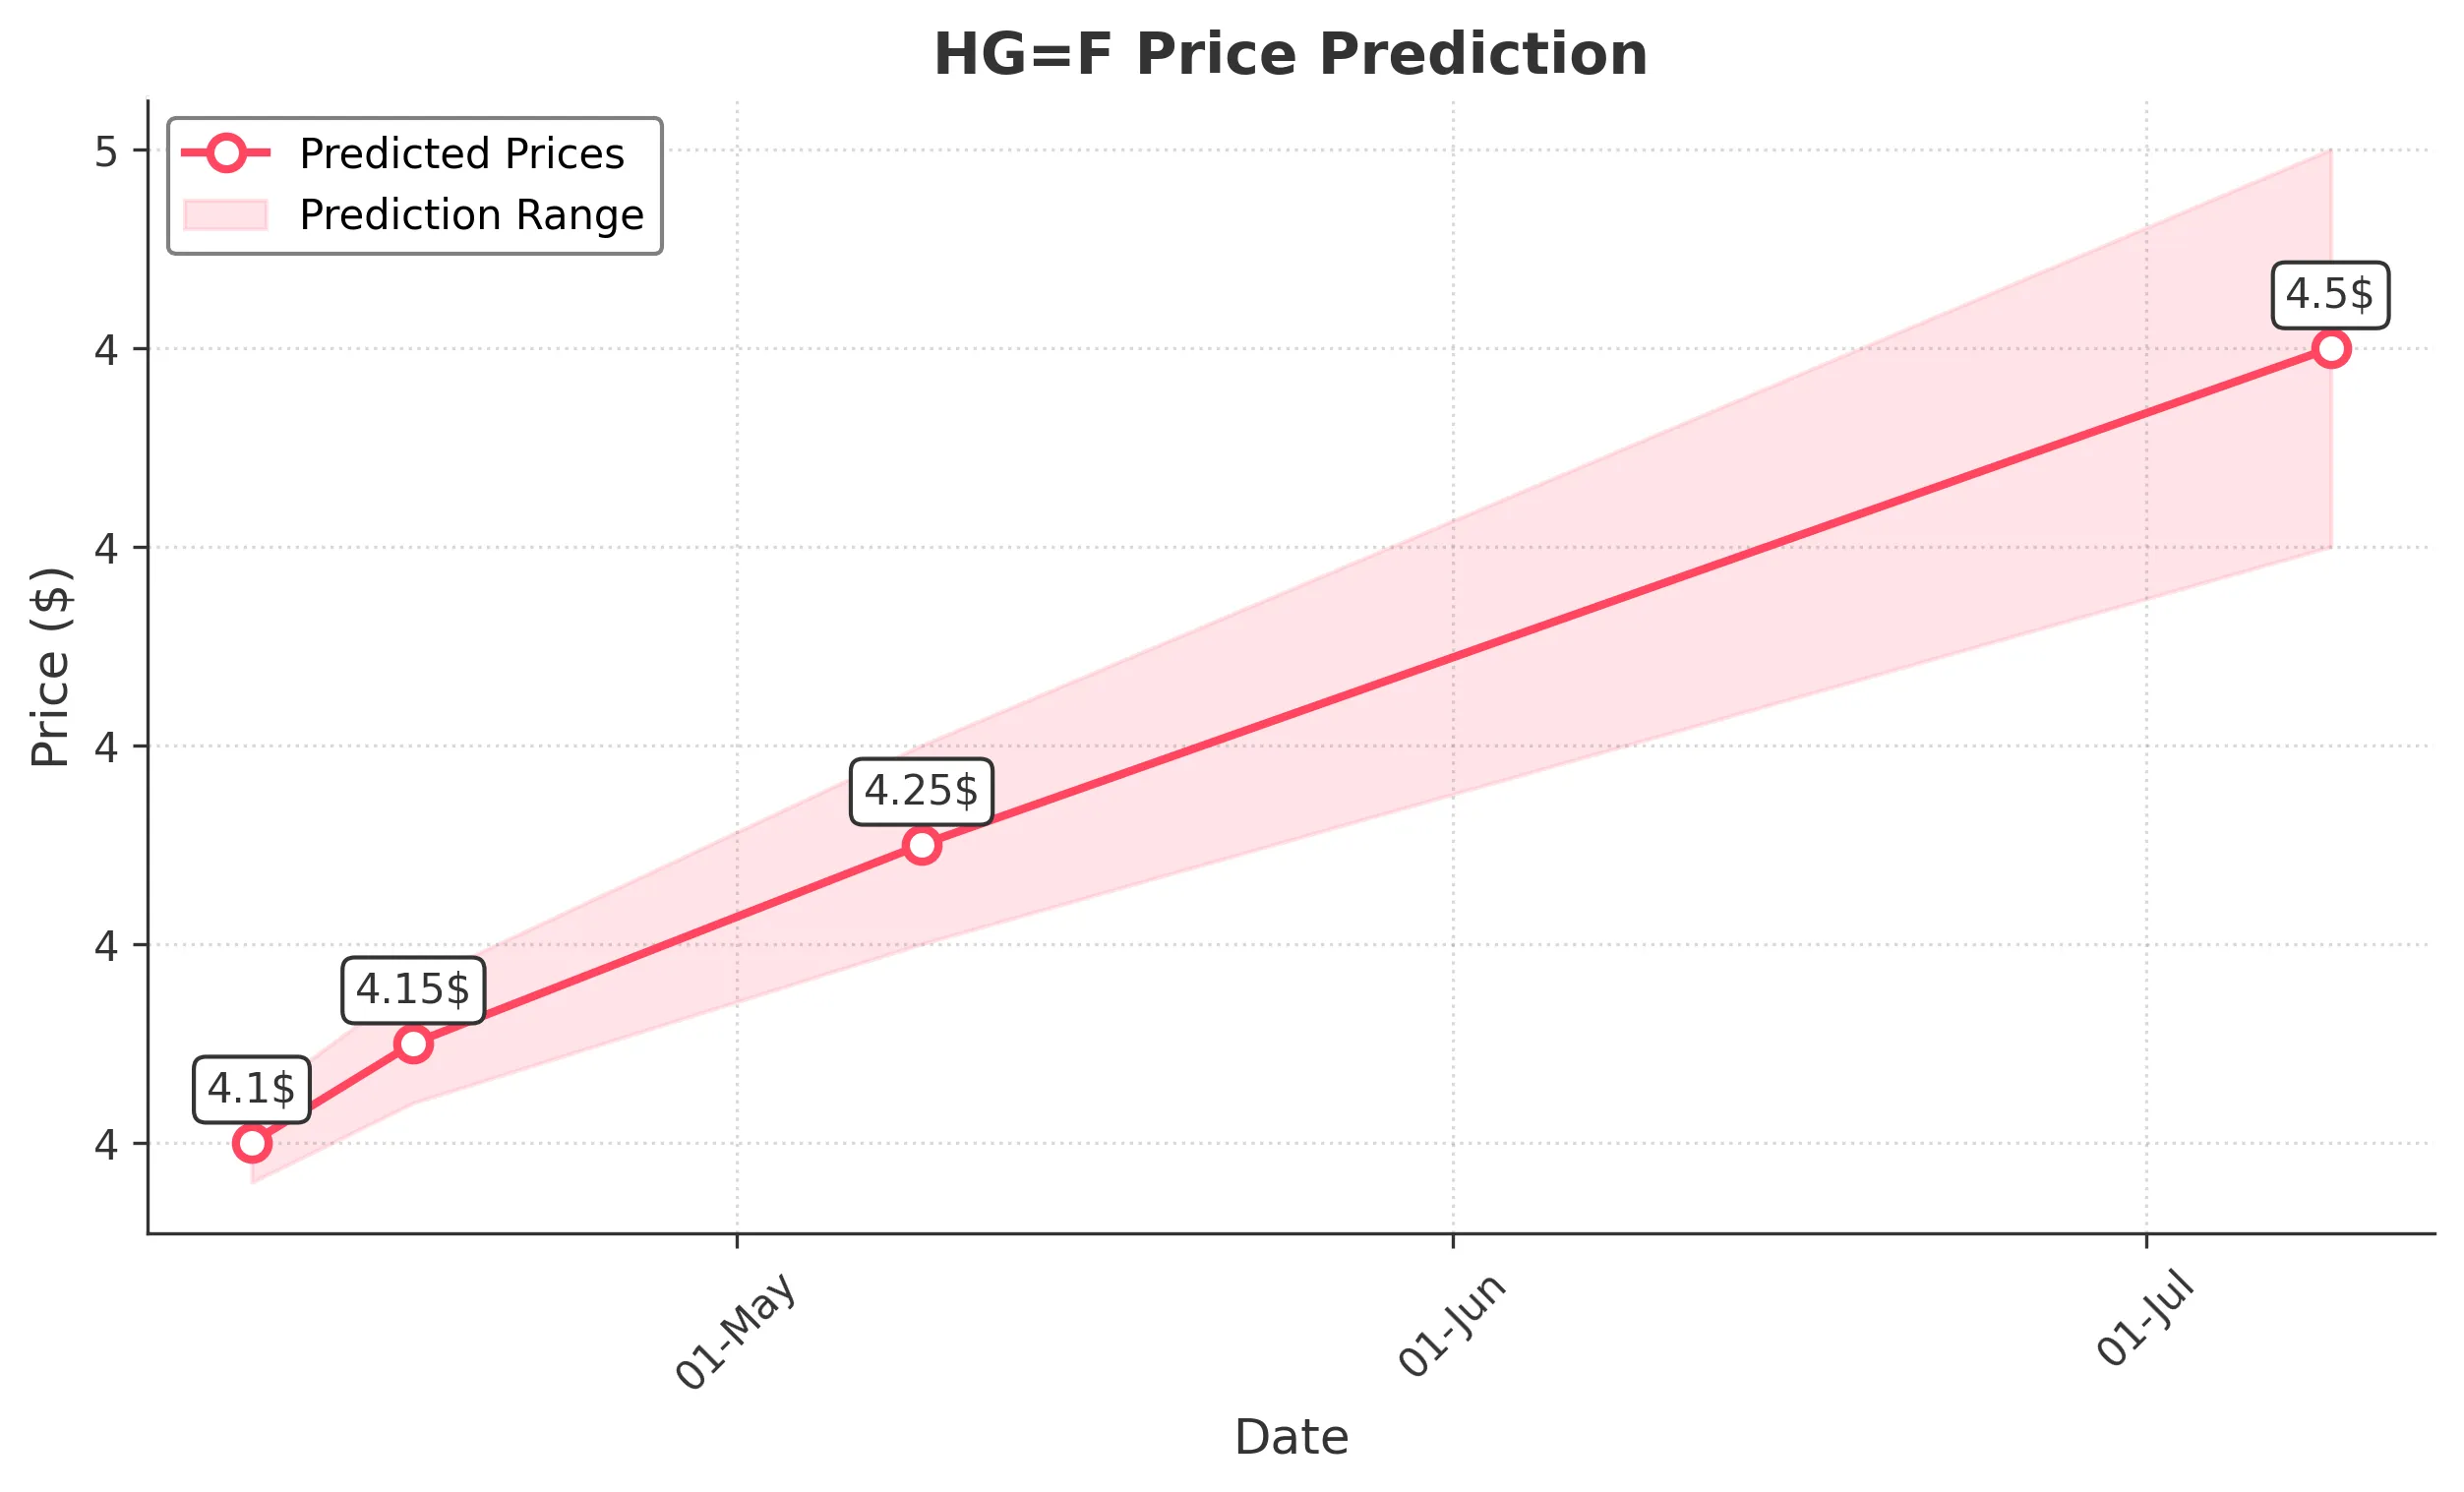
Target: April 10, 2025$4.1
$4.11
$4.12
$4.08
Description
The stock shows a bearish trend with recent lower closes. The RSI indicates oversold conditions, suggesting a potential bounce. However, the MACD is bearish, and volume has been declining, indicating weak buying interest.
Analysis
Over the past 3 months, HG=F has shown a bearish trend with significant resistance around 5.10. The recent drop below 4.30 indicates weakness. The ATR suggests increased volatility, and the volume patterns show declining interest. Candlestick patterns indicate potential reversal points, but overall sentiment remains cautious.
Confidence Level
Potential Risks
Market volatility and external news could impact the prediction. A sudden bullish reversal is possible if sentiment shifts.
1 Week Prediction
Target: April 17, 2025$4.15
$4.14
$4.18
$4.12
Description
A slight recovery is expected as the stock may find support around 4.10. The RSI is approaching neutral, and a potential bullish divergence is forming. However, the overall trend remains bearish, limiting upside potential.
Analysis
The stock has been in a downtrend, with key support at 4.10. The MACD is bearish, but the RSI shows signs of recovery. Volume has been inconsistent, indicating uncertainty. The market sentiment is cautious, and macroeconomic factors could further influence price action.
Confidence Level
Potential Risks
The bearish trend could continue if market sentiment worsens. External factors or economic data releases may influence price movements.
1 Month Prediction
Target: May 9, 2025$4.25
$4.24
$4.3
$4.2
Description
A gradual recovery is anticipated as the stock may stabilize around 4.25. The RSI is expected to improve, and if the price holds above 4.10, it could signal a reversal. However, bearish sentiment persists.
Analysis
The stock has faced significant selling pressure, with resistance at 4.30. The Bollinger Bands indicate potential for a bounce, but the overall trend remains bearish. Volume patterns suggest a lack of strong buying interest, and external factors could impact future performance.
Confidence Level
Potential Risks
Continued bearish pressure could lead to further declines. Economic indicators and market sentiment will play a crucial role in determining the stock's direction.
3 Months Prediction
Target: July 9, 2025$4.5
$4.48
$4.6
$4.4
Description
A potential recovery towards 4.50 is expected if the stock can break above 4.30. The RSI may stabilize, and if bullish momentum builds, it could lead to a more sustained uptrend. However, risks remain.
Analysis
The stock has been in a bearish phase, with significant resistance at 4.30. The MACD remains bearish, but potential bullish signals are emerging. Volume has been low, indicating weak interest. External economic factors and market sentiment will be critical in shaping future performance.
Confidence Level
Potential Risks
Market conditions and economic developments could hinder recovery. A failure to break resistance may lead to further declines.