HGF Trading Predictions
1 Day Prediction
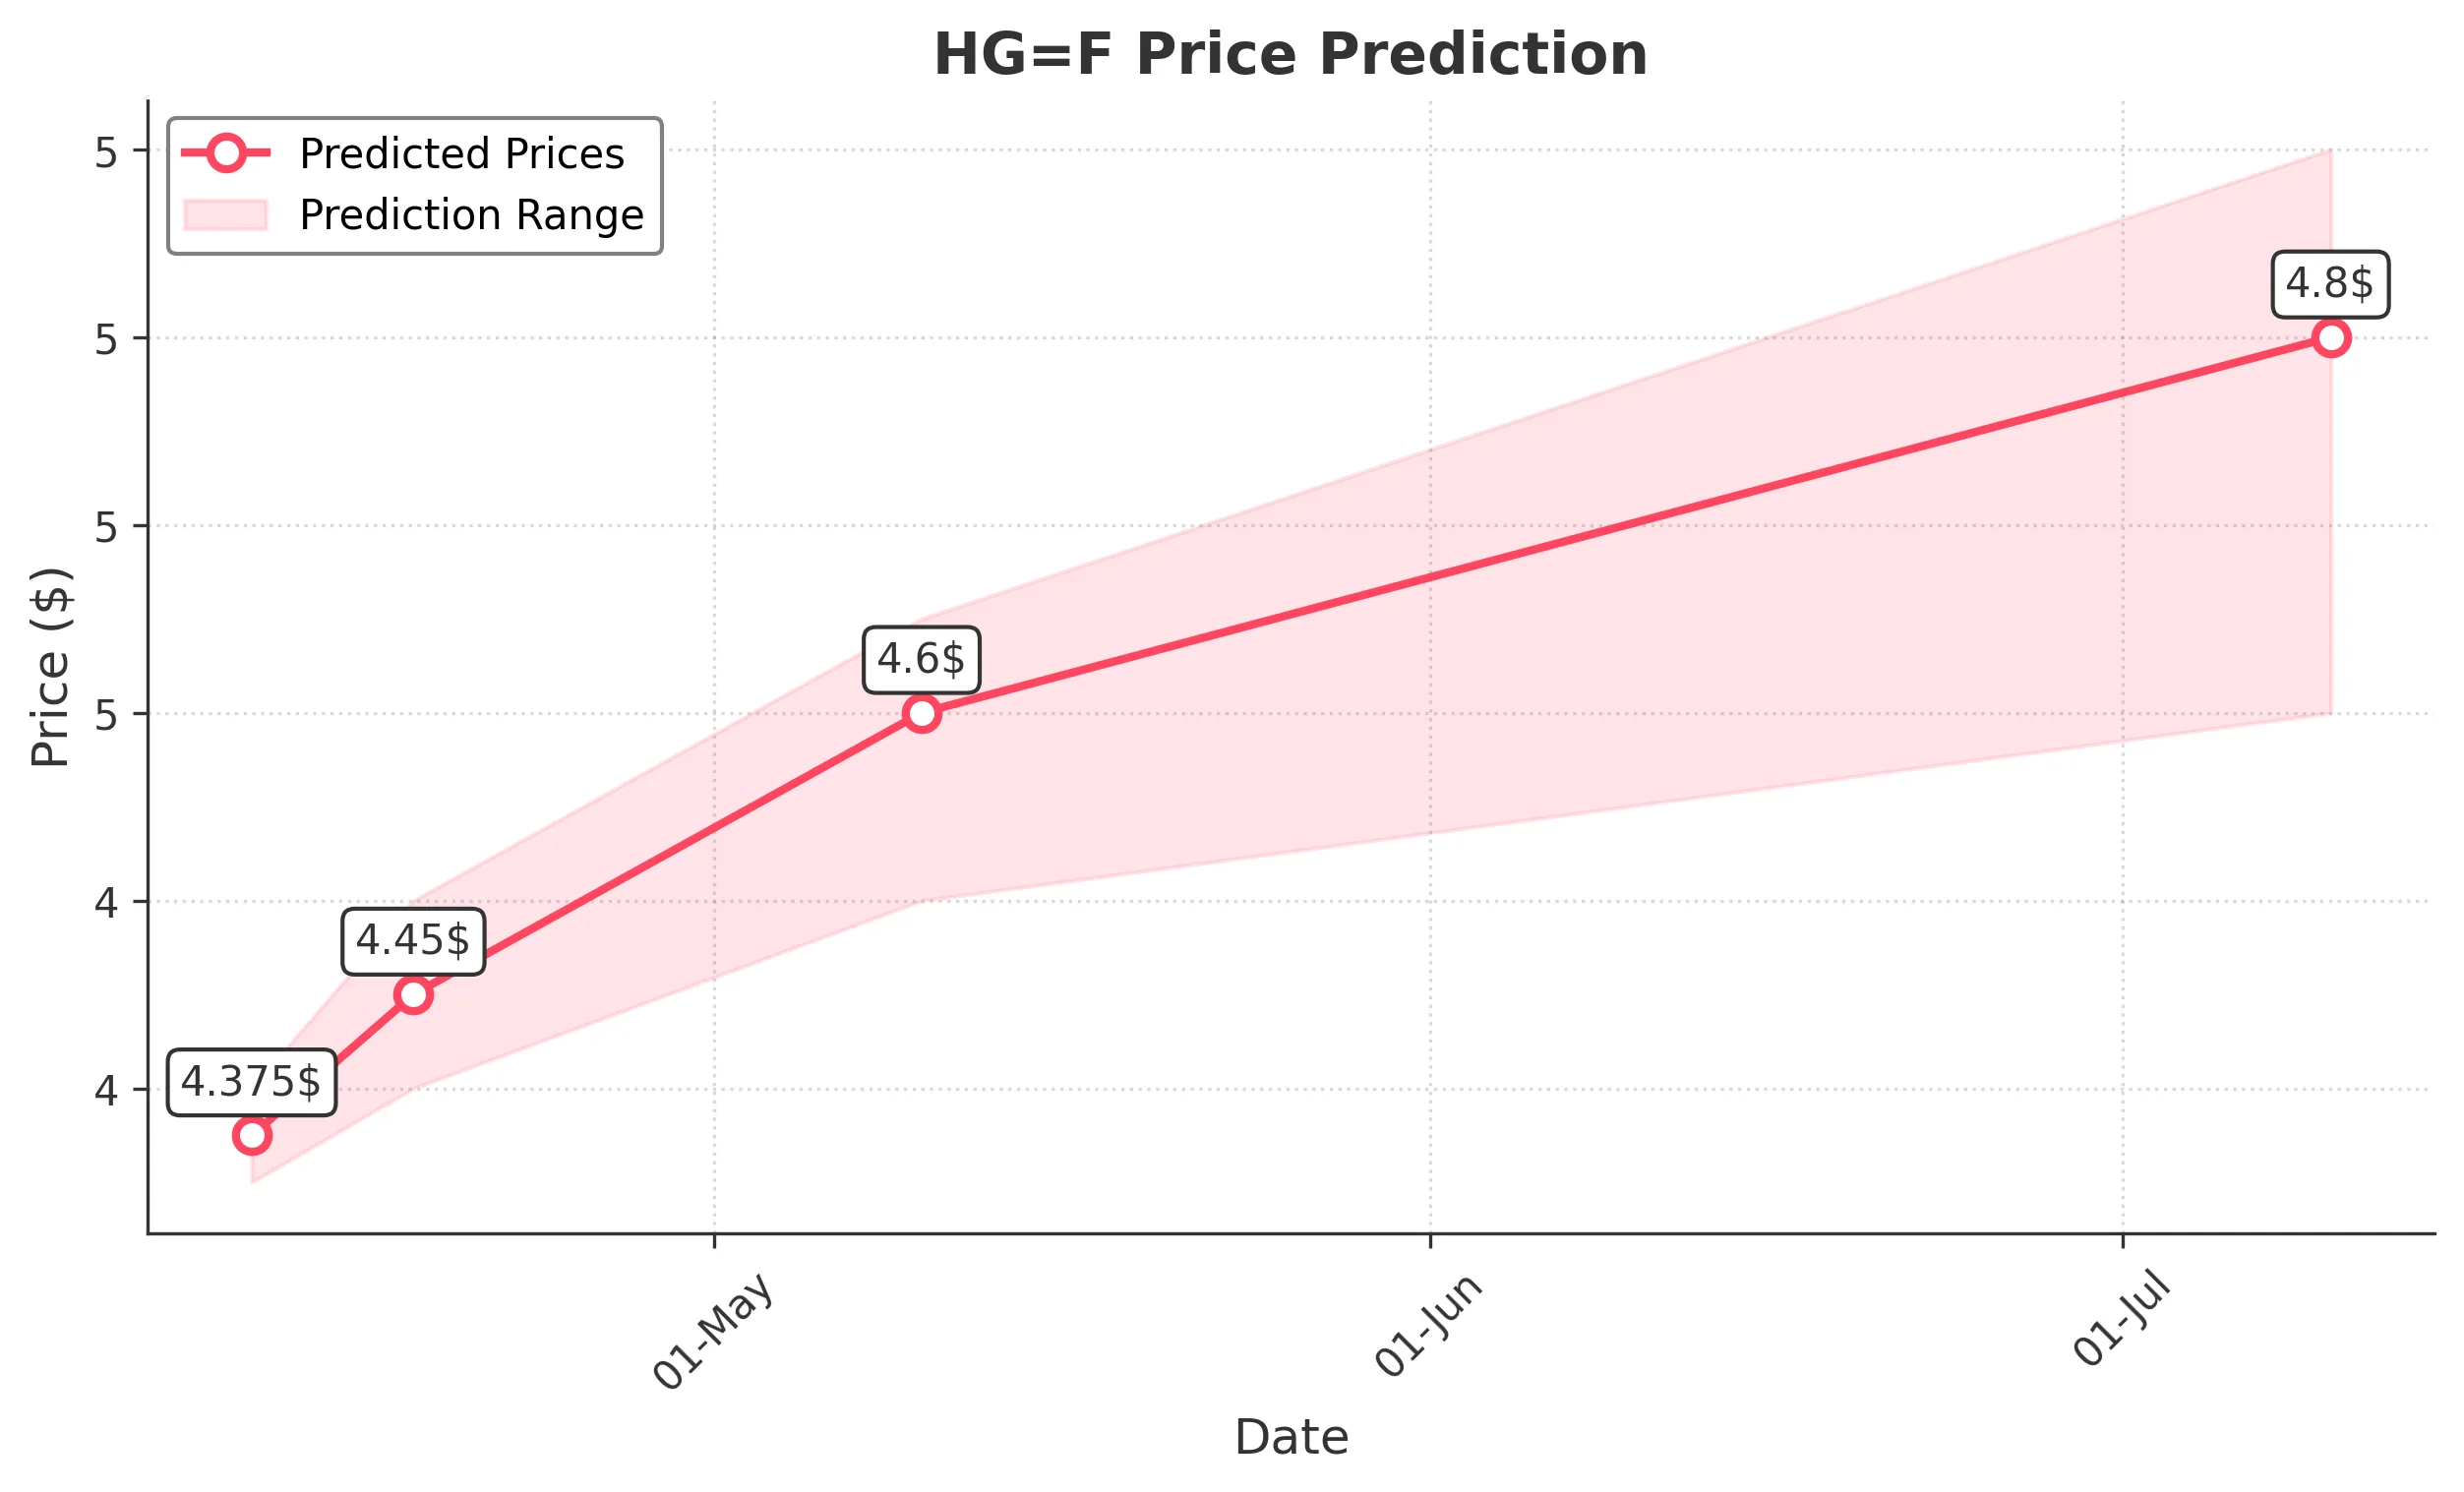
Target: April 11, 2025$4.375
$4.36
$4.4
$4.35
Description
The stock shows a slight bullish trend with a recent Doji candlestick indicating indecision. The RSI is near 50, suggesting a neutral momentum. Expect a minor rebound as it approaches support at 4.35.
Analysis
Over the past 3 months, HG=F has shown a bearish trend with significant support at 4.35. The recent price action indicates potential for a short-term bounce, but overall sentiment remains cautious.
Confidence Level
Potential Risks
Market volatility and external news could impact the price direction.
1 Week Prediction
Target: April 18, 2025$4.45
$4.425
$4.5
$4.4
Description
A potential recovery is indicated as the stock approaches a Fibonacci retracement level. The MACD shows a bullish crossover, suggesting upward momentum. However, resistance at 4.50 may limit gains.
Analysis
The stock has been in a bearish phase, but recent price action suggests a possible reversal. Key resistance at 4.50 and support at 4.35 will be critical in determining the next move.
Confidence Level
Potential Risks
Resistance levels and market sentiment could hinder upward movement.
1 Month Prediction
Target: May 10, 2025$4.6
$4.55
$4.65
$4.5
Description
The stock is expected to continue its recovery, supported by bullish signals from the MACD and RSI. A break above 4.50 could lead to further gains, but watch for potential pullbacks.
Analysis
The stock has shown signs of recovery, but the overall trend remains uncertain. Key resistance levels will need to be monitored closely, and external factors could influence price movements.
Confidence Level
Potential Risks
Unforeseen macroeconomic events could disrupt the recovery trend.
3 Months Prediction
Target: July 10, 2025$4.8
$4.75
$4.9
$4.6
Description
If the bullish trend continues, the stock could reach 4.80, supported by a favorable market environment. However, any significant downturn in market sentiment could reverse this trend.
Analysis
The stock has been in a bearish trend but shows signs of potential recovery. Key resistance levels will be crucial, and external economic factors could significantly impact future performance.
Confidence Level
Potential Risks
Long-term predictions are highly uncertain due to market volatility and potential economic shifts.