HGF Trading Predictions
1 Day Prediction
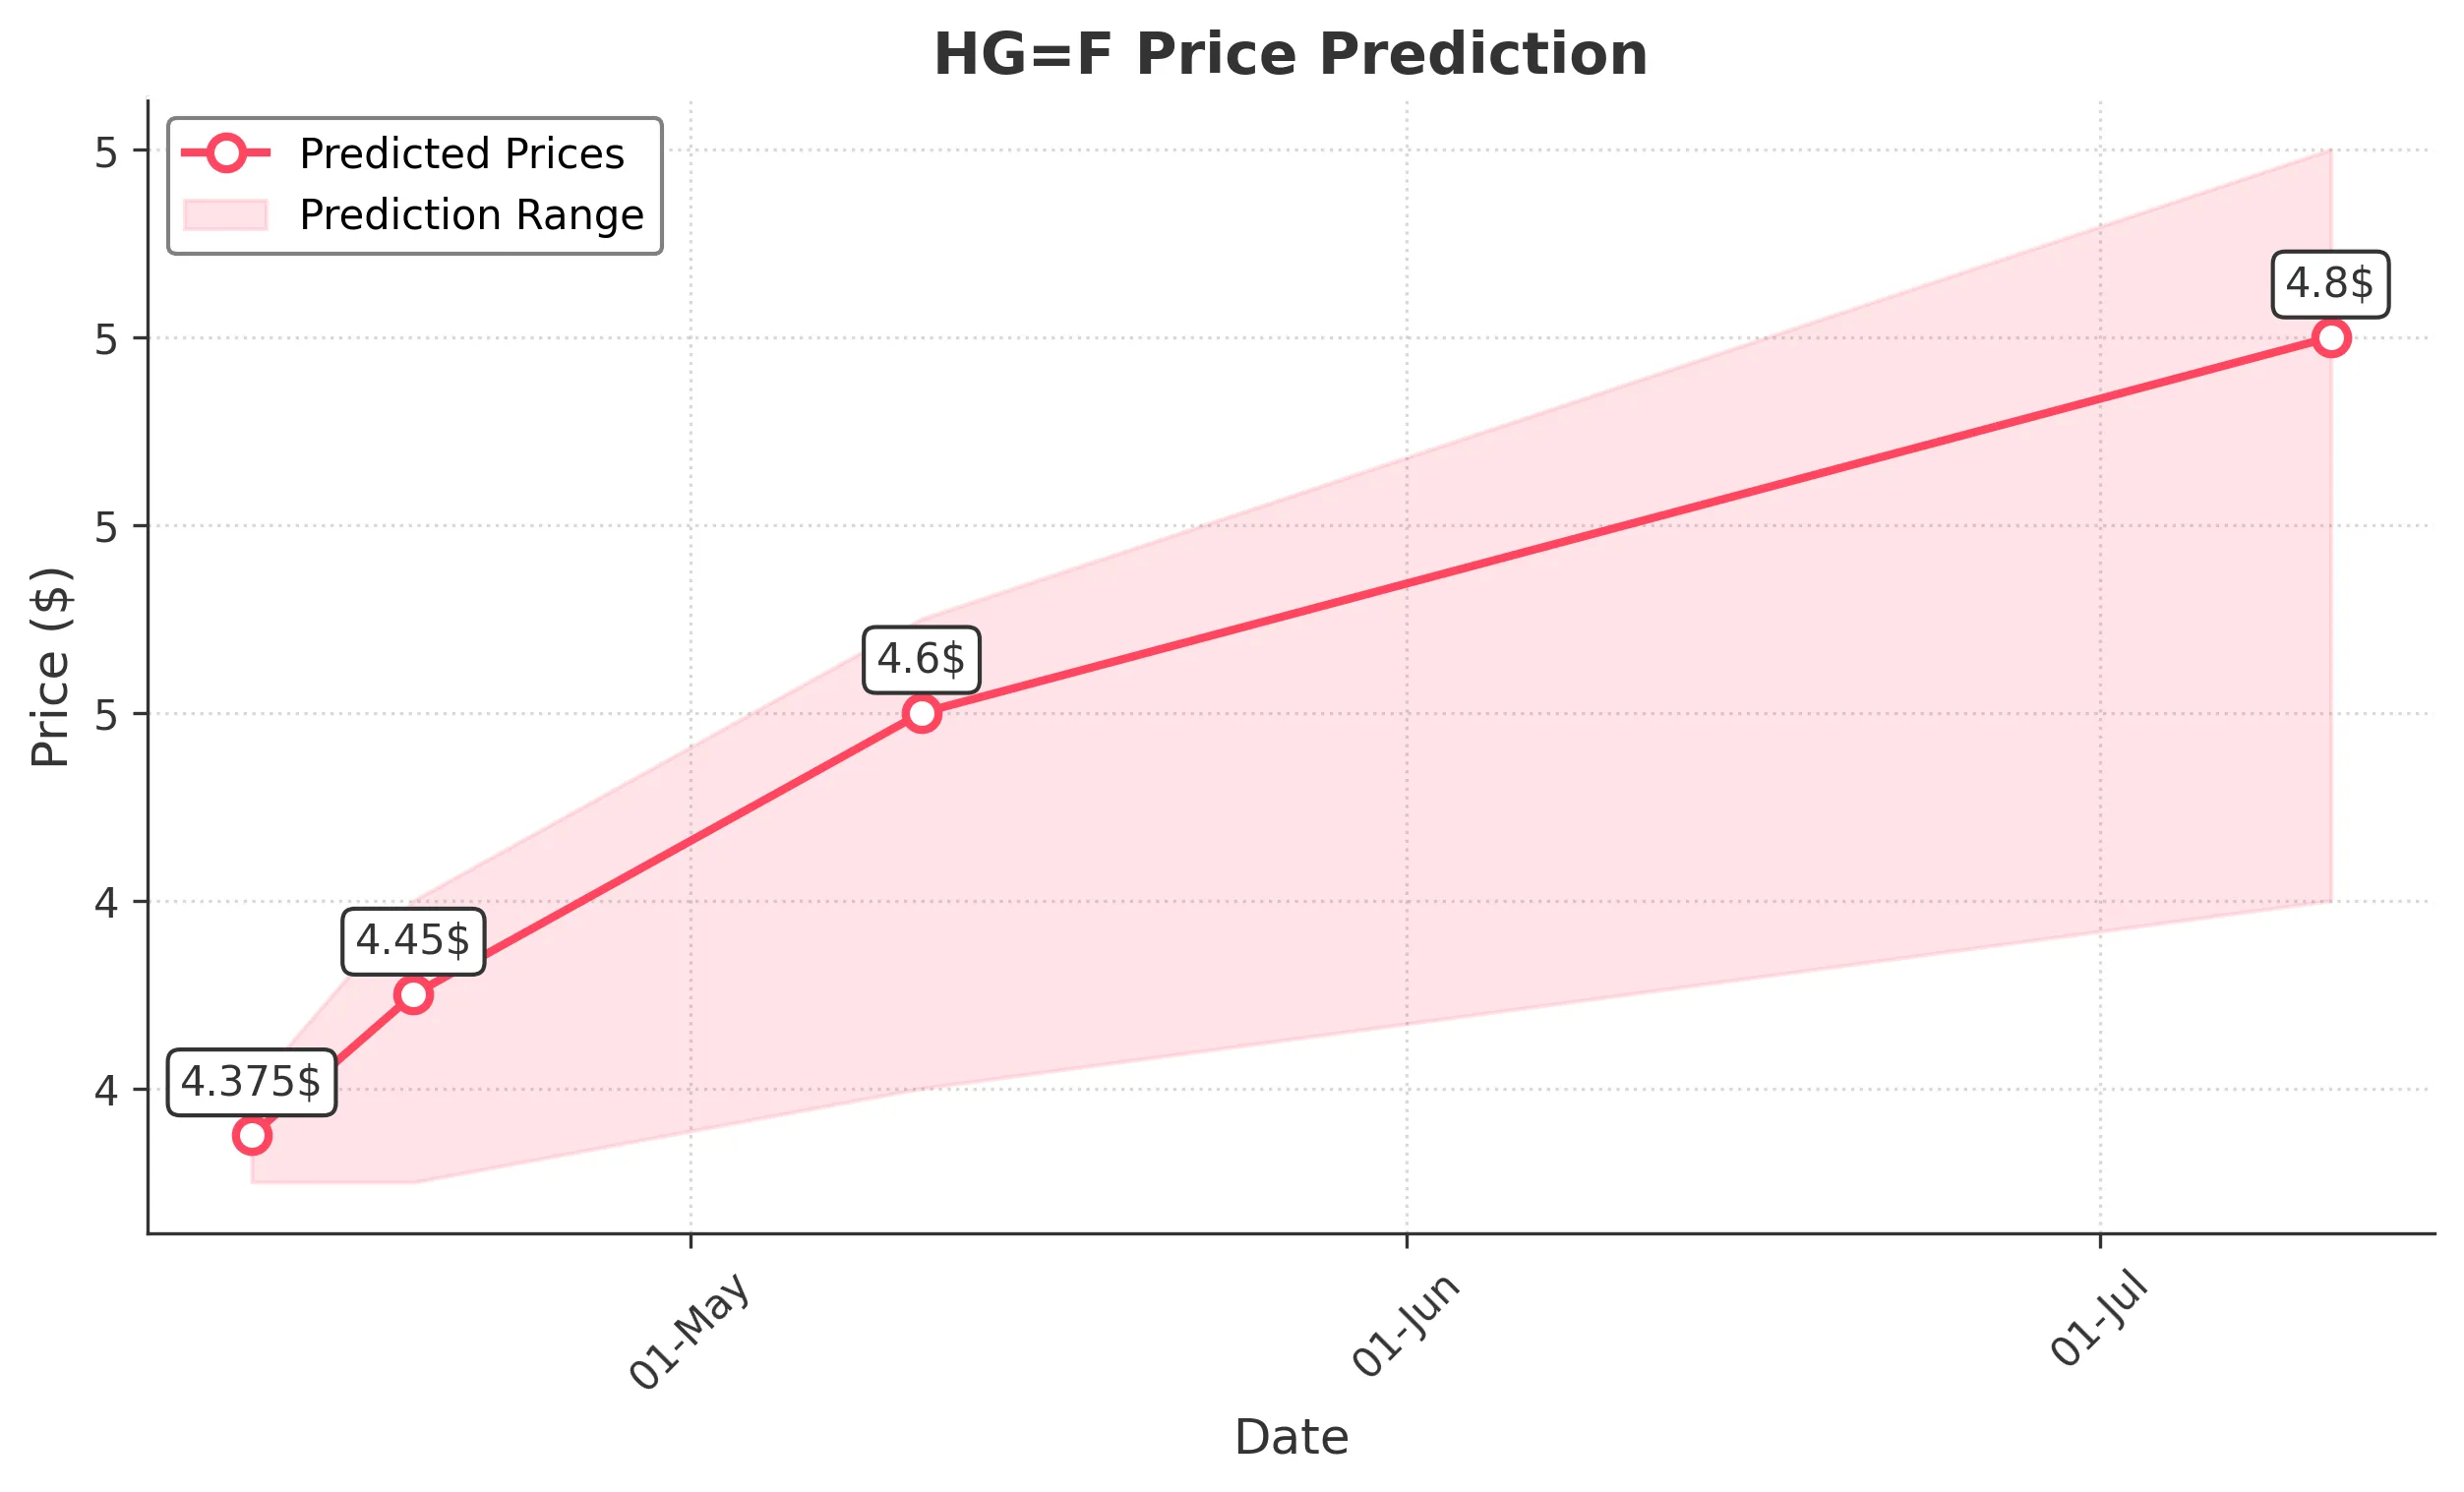
Target: April 12, 2025$4.375
$4.36
$4.4
$4.35
Description
The stock shows a slight bullish trend with a recent Doji pattern indicating indecision. The RSI is near 50, suggesting a neutral momentum. Expect a minor rebound as it approaches support at 4.35.
Analysis
Over the past 3 months, HG=F has shown a bearish trend with significant support at 4.35. Recent volume spikes indicate potential reversals, but the overall sentiment remains cautious. Technical indicators suggest a possible short-term recovery.
Confidence Level
Potential Risks
Market volatility and external news could impact the price direction.
1 Week Prediction
Target: April 19, 2025$4.45
$4.375
$4.5
$4.35
Description
A potential bullish reversal is indicated by the recent Hammer candlestick pattern. The MACD shows a bullish crossover, and the RSI is improving, suggesting upward momentum.
Analysis
The stock has been fluctuating around key support levels. The recent bullish signals from technical indicators suggest a possible recovery. However, the overall market sentiment remains cautious, and external factors could influence price movements.
Confidence Level
Potential Risks
Unforeseen macroeconomic events could disrupt this trend.
1 Month Prediction
Target: May 11, 2025$4.6
$4.45
$4.65
$4.4
Description
The stock is expected to continue its upward trend as it breaks above resistance at 4.50. The Bollinger Bands indicate potential for expansion, and the RSI is trending upwards, supporting bullish sentiment.
Analysis
The past three months have shown a bearish trend, but recent bullish patterns and volume spikes suggest a potential recovery. Key resistance levels are being tested, and the market sentiment is cautiously optimistic.
Confidence Level
Potential Risks
Market corrections or negative news could reverse this trend.
3 Months Prediction
Target: July 11, 2025$4.8
$4.6
$4.9
$4.5
Description
If the bullish trend continues, the stock could reach 4.80, supported by a strong upward momentum. The Fibonacci retracement levels indicate potential resistance at 4.85, but overall sentiment is positive.
Analysis
The stock has shown significant fluctuations, with a recent shift towards bullish patterns. However, the overall market remains uncertain, and external factors could impact future performance. Key resistance levels will be critical to watch.
Confidence Level
Potential Risks
Long-term predictions are subject to market volatility and economic changes.