HGF Trading Predictions
1 Day Prediction
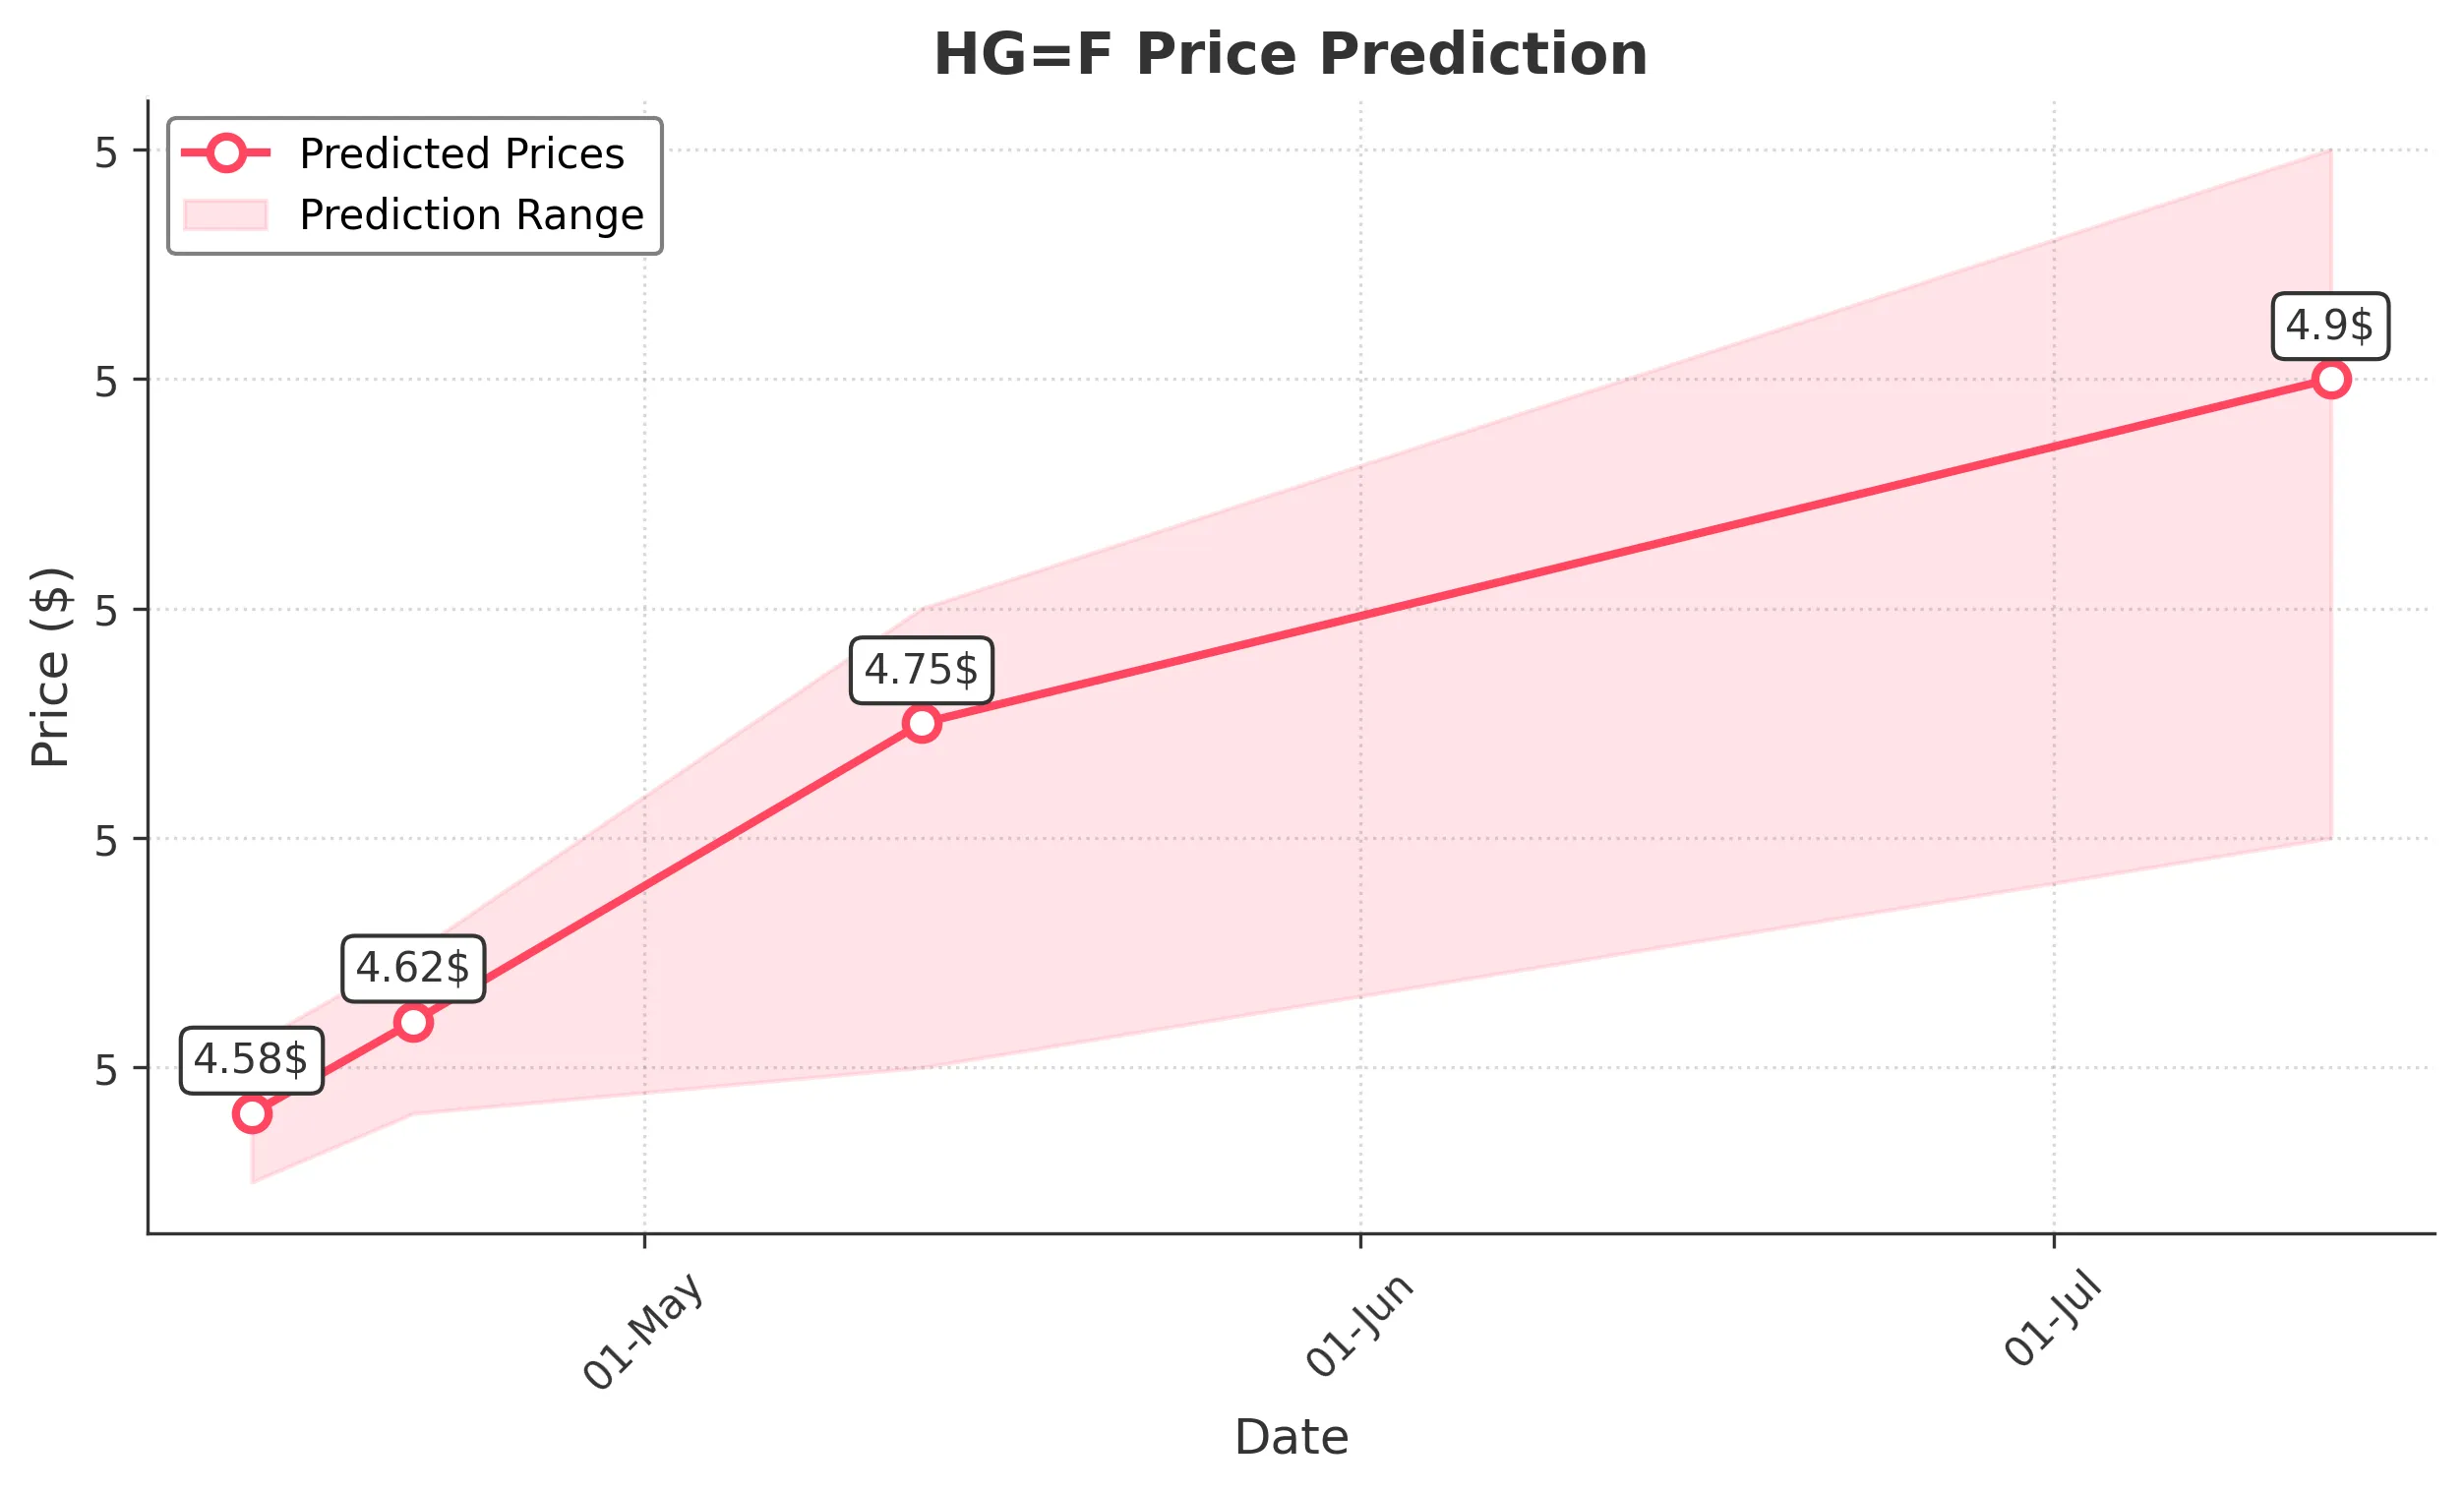
Target: April 14, 2025$4.58
$4.57
$4.61
$4.55
Description
The stock shows a slight bullish trend with a recent close above the 50-day moving average. RSI indicates overbought conditions, suggesting a potential pullback. However, the overall sentiment remains positive, supported by recent volume spikes.
Analysis
Over the past 3 months, HG=F has shown a bullish trend with significant support at 4.15 and resistance around 5.10. Recent volume spikes indicate increased interest, but the RSI suggests caution. The stock has experienced volatility, influenced by macroeconomic factors.
Confidence Level
Potential Risks
Potential reversal due to overbought RSI and market volatility could impact the prediction.
1 Week Prediction
Target: April 21, 2025$4.62
$4.59
$4.65
$4.58
Description
The stock is expected to maintain its upward momentum, supported by bullish candlestick patterns and a favorable MACD crossover. However, the RSI remains elevated, indicating potential resistance ahead.
Analysis
The stock has been in a bullish phase, with key support at 4.50 and resistance at 4.70. The MACD indicates a bullish crossover, while the ATR suggests increasing volatility. Volume patterns show interest, but caution is advised due to potential overbought conditions.
Confidence Level
Potential Risks
Market sentiment could shift due to external economic news, impacting the stock's performance.
1 Month Prediction
Target: May 13, 2025$4.75
$4.7
$4.8
$4.6
Description
The stock is projected to continue its upward trend, supported by bullish technical indicators. However, the RSI suggests it may face resistance around 4.75, indicating a potential consolidation phase.
Analysis
In the last three months, HG=F has shown a strong bullish trend with significant resistance at 4.75. The MACD remains bullish, and volume patterns indicate sustained interest. However, the stock's RSI suggests it may be nearing overbought territory.
Confidence Level
Potential Risks
Economic data releases could introduce volatility, affecting the stock's trajectory.
3 Months Prediction
Target: July 13, 2025$4.9
$4.85
$5
$4.7
Description
The stock is expected to reach new highs, driven by positive market sentiment and strong technical indicators. However, potential economic headwinds could create volatility.
Analysis
The stock has shown a bullish trend with key support at 4.50 and resistance at 5.00. The MACD indicates a strong bullish momentum, but the RSI suggests caution. Volume patterns indicate interest, but external factors could introduce volatility.
Confidence Level
Potential Risks
Unforeseen macroeconomic events could lead to significant price fluctuations.