HGF Trading Predictions
1 Day Prediction
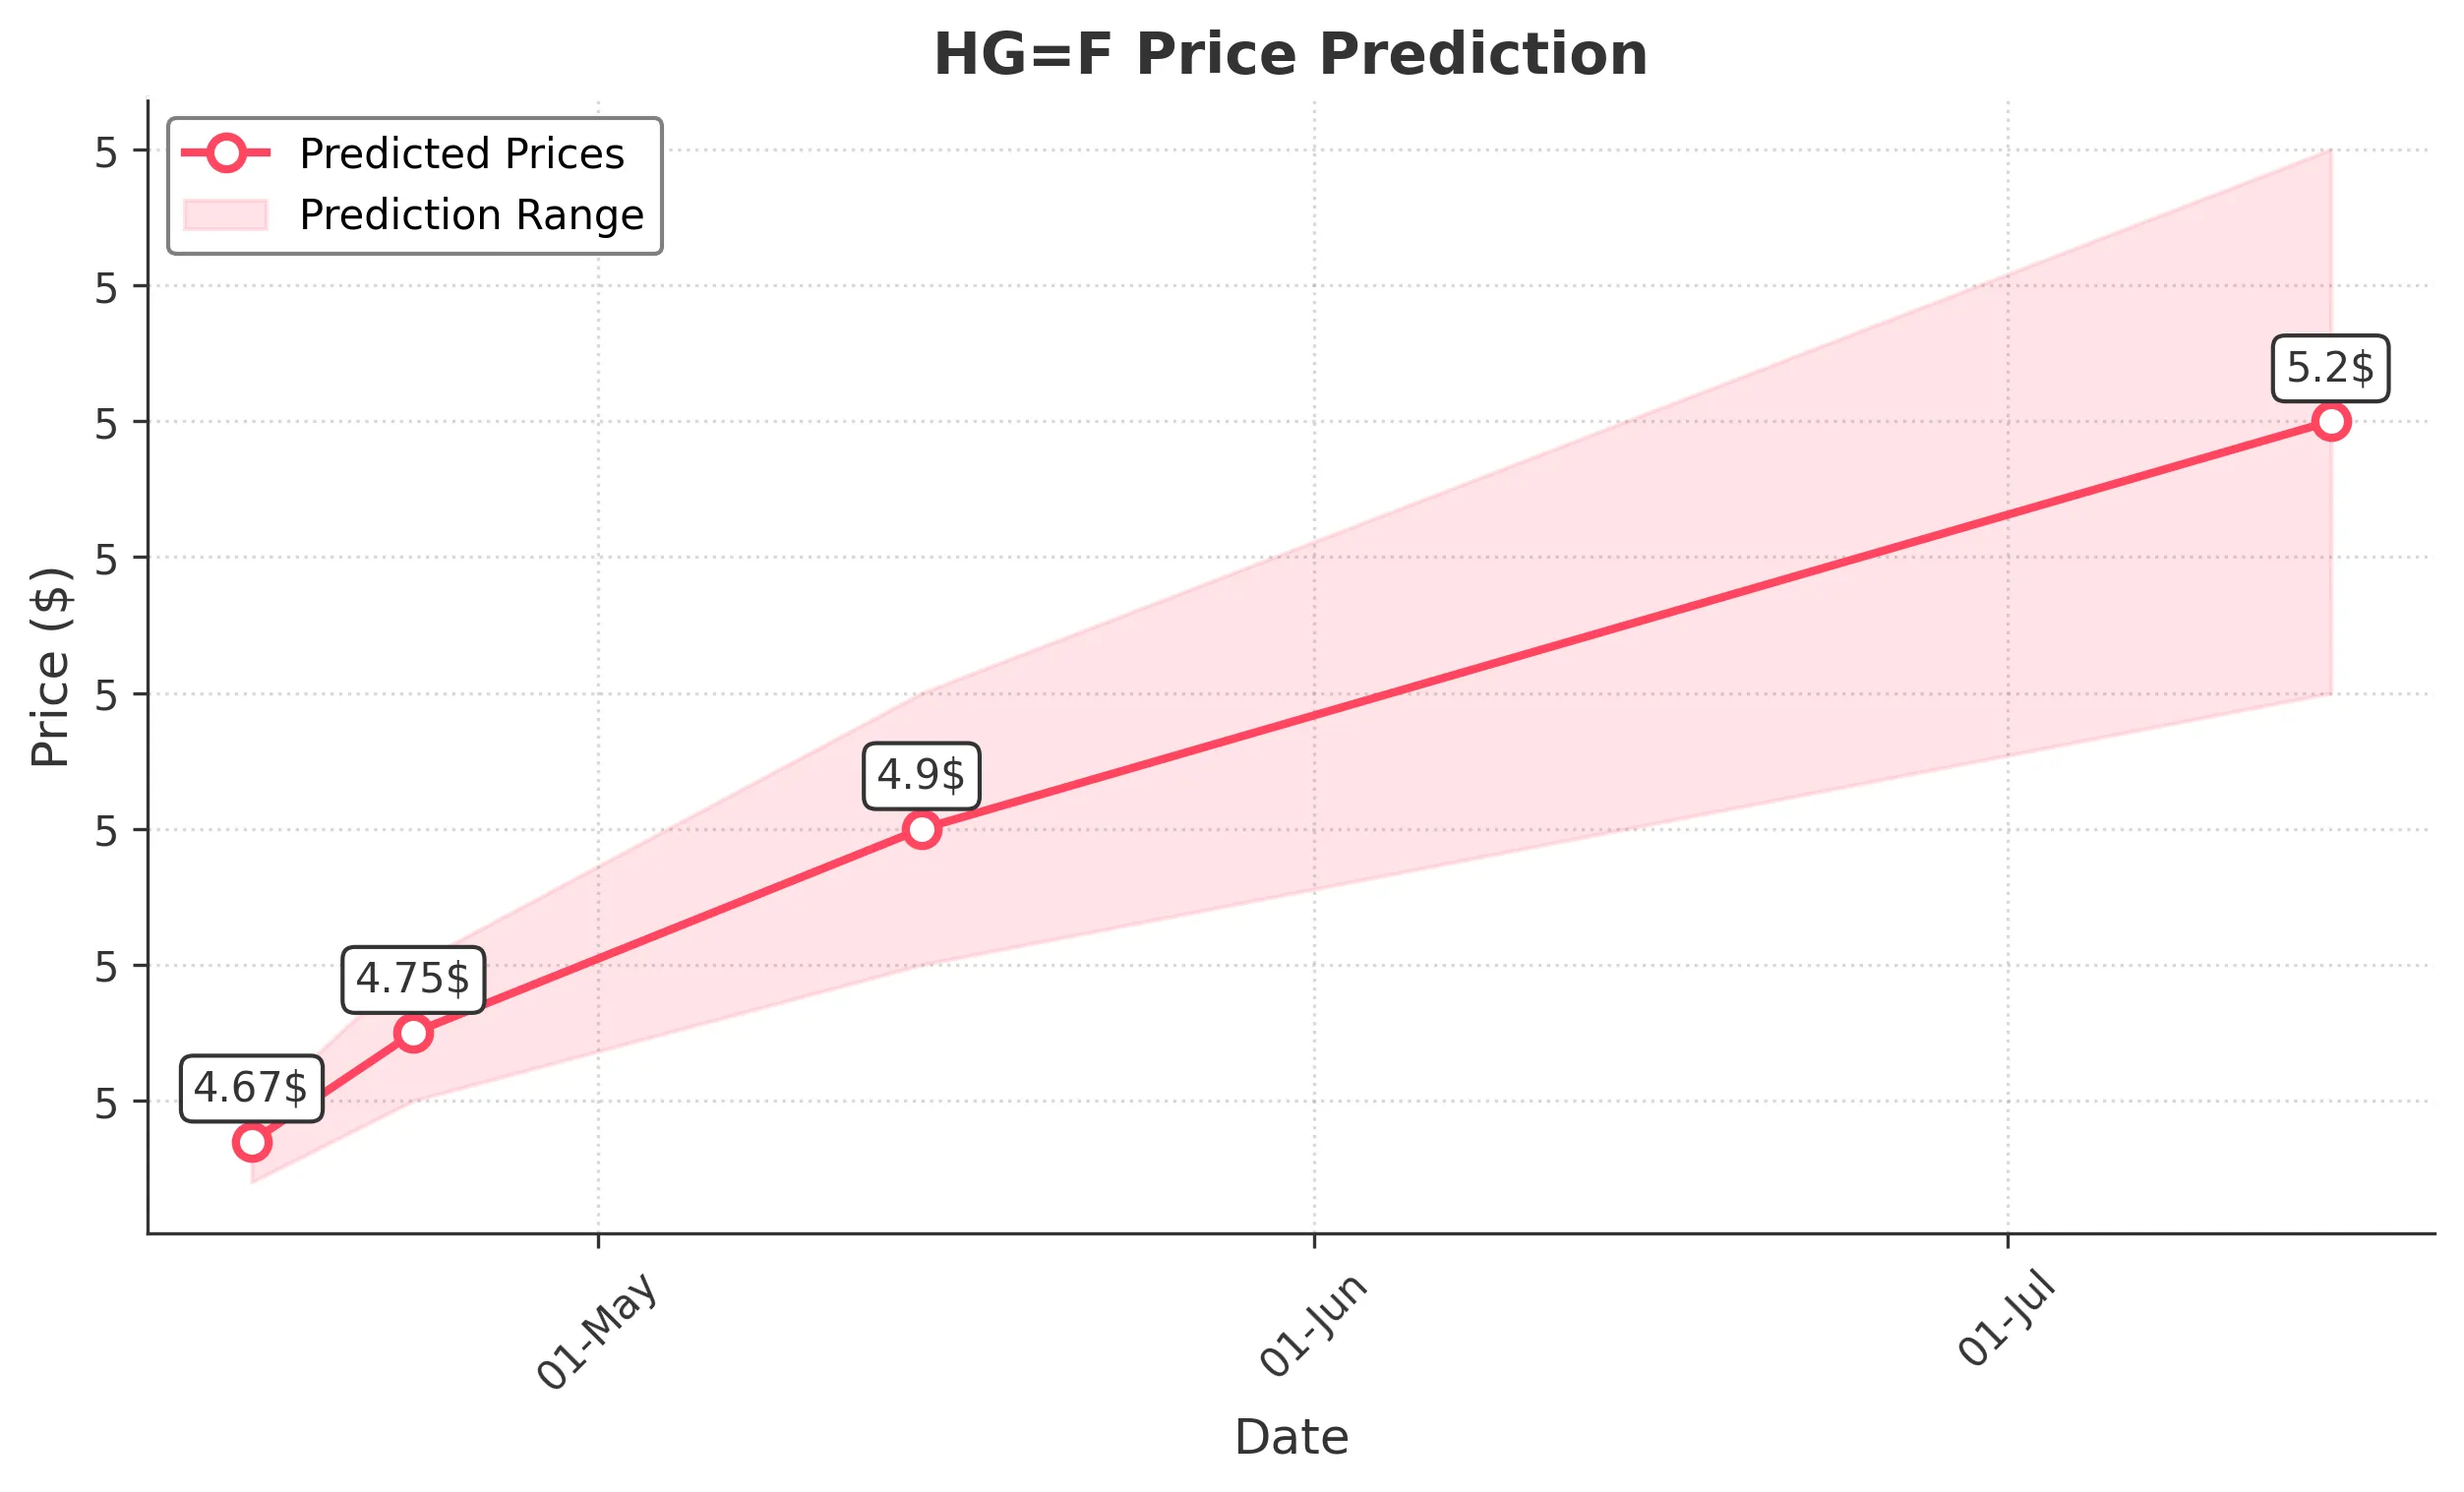
Target: April 16, 2025$4.67
$4.65
$4.69
$4.64
Description
The stock shows a bullish trend with a recent upward movement. The RSI is approaching overbought levels, indicating potential for a pullback. However, the MACD is positive, suggesting continued momentum. Volume is expected to increase as traders react to recent highs.
Analysis
Over the past 3 months, HG=F has shown a bullish trend with significant support at 4.15 and resistance around 5.10. The recent price action indicates a strong upward momentum, but volatility has increased, suggesting caution. Volume spikes on upward days indicate strong buying interest.
Confidence Level
Potential Risks
Potential for a reversal exists if market sentiment shifts or if macroeconomic news impacts trading.
1 Week Prediction
Target: April 23, 2025$4.75
$4.72
$4.8
$4.7
Description
The stock is expected to continue its upward trajectory, supported by bullish candlestick patterns and positive MACD. However, the RSI indicates overbought conditions, which may lead to a short-term pullback. Volume is likely to remain steady as traders monitor price action.
Analysis
The stock has been in a bullish phase, with key support at 4.50 and resistance at 5.00. The recent price action shows strong buying interest, but the RSI suggests caution as it approaches overbought territory. Volume patterns indicate healthy trading activity.
Confidence Level
Potential Risks
Market volatility and external economic factors could impact the stock's performance, leading to unexpected price movements.
1 Month Prediction
Target: May 15, 2025$4.9
$4.85
$5
$4.8
Description
The stock is projected to reach higher levels as bullish sentiment persists. The MACD remains positive, and the price is above the 50-day moving average. However, the RSI indicates potential overbought conditions, suggesting a possible correction in the near term.
Analysis
The stock has shown a strong bullish trend, with significant resistance at 5.00. The recent price action indicates a healthy upward movement, but the increasing volatility and overbought RSI signal potential corrections. Volume analysis shows consistent buying interest.
Confidence Level
Potential Risks
Economic indicators and geopolitical events could introduce volatility, impacting the stock's upward momentum.
3 Months Prediction
Target: July 15, 2025$5.2
$5.1
$5.4
$5
Description
The stock is expected to continue its upward trend, driven by strong market sentiment and positive technical indicators. However, the potential for market corrections exists, especially if economic conditions change. Volume may fluctuate as traders react to price movements.
Analysis
Over the past three months, HG=F has demonstrated a bullish trend with key support at 4.50 and resistance at 5.10. The stock's performance has been influenced by positive market sentiment, but external factors could lead to increased volatility. The overall outlook remains cautiously optimistic.
Confidence Level
Potential Risks
Long-term predictions are subject to greater uncertainty due to potential market shifts and economic changes that could impact investor sentiment.