HGF Trading Predictions
1 Day Prediction
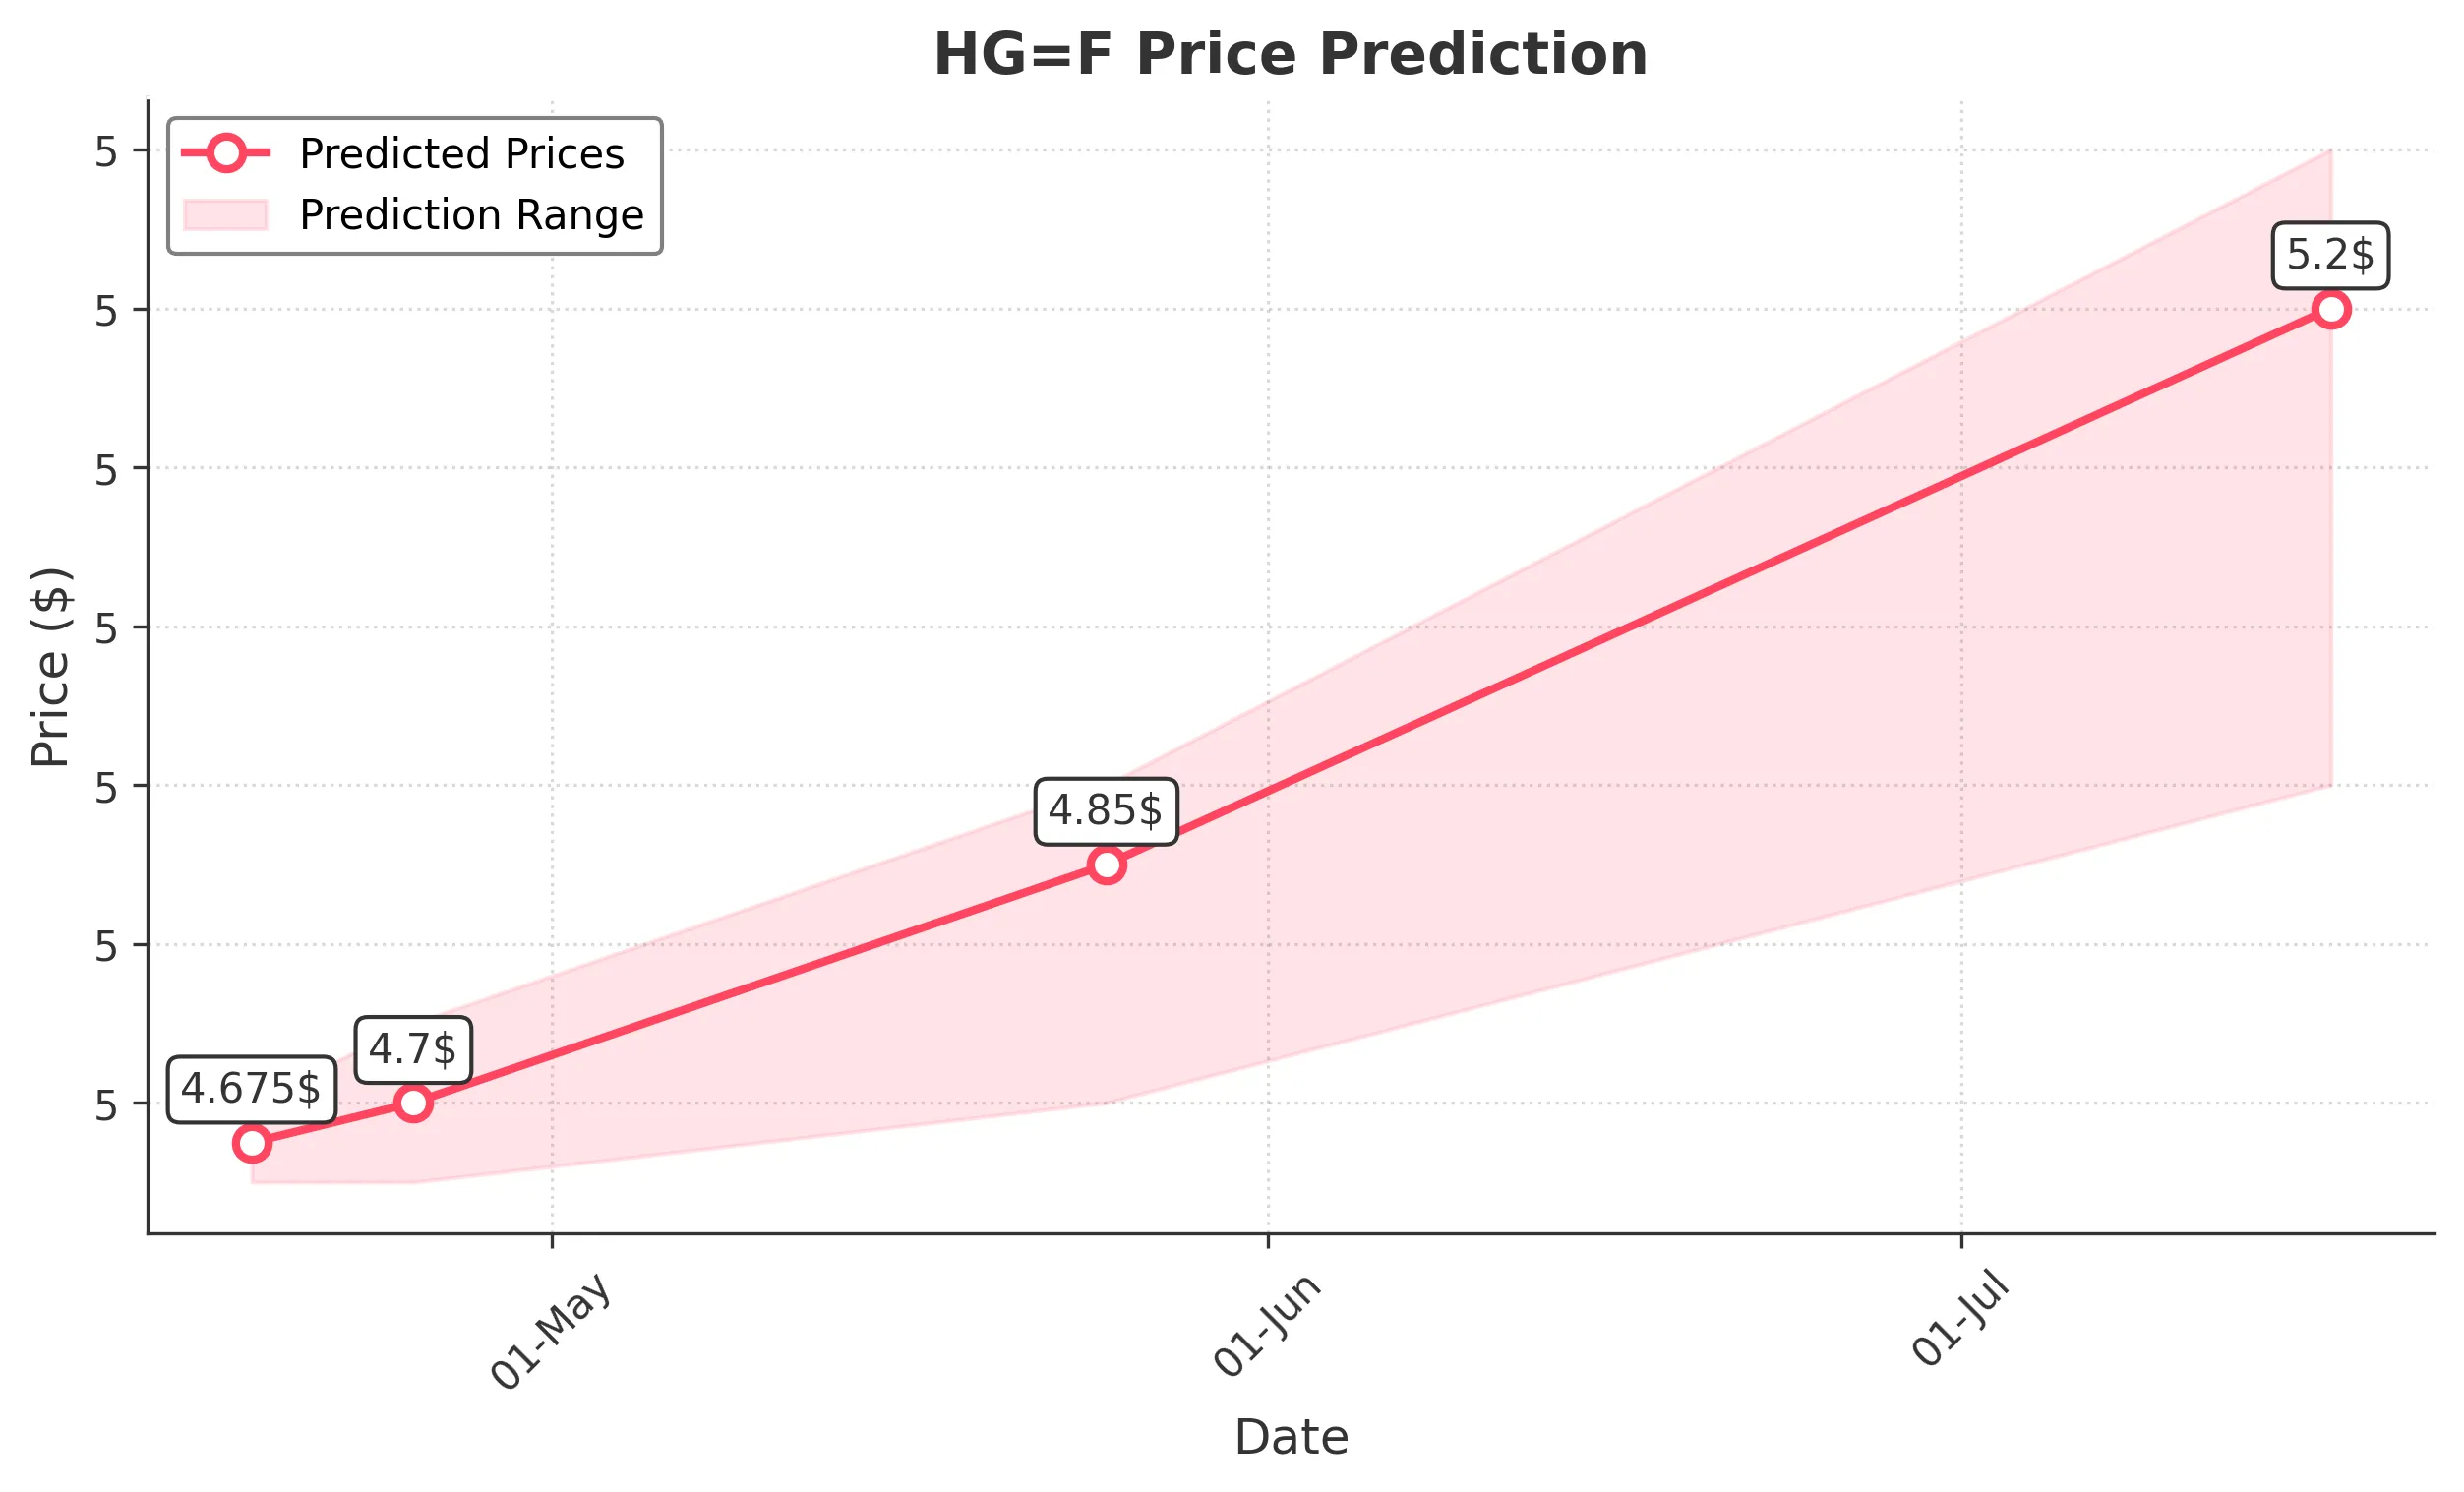
Target: April 18, 2025$4.675
$4.67
$4.7
$4.65
Description
The stock shows a slight bullish trend with a recent close above the 50-day moving average. RSI is neutral, indicating no overbought conditions. A potential Doji pattern suggests indecision, but overall sentiment remains positive.
Analysis
Over the past 3 months, HG=F has shown a bullish trend with significant support around 4.15 and resistance near 5.10. Recent volume spikes indicate increased interest. However, the stock has faced some bearish pressure recently, suggesting caution.
Confidence Level
Potential Risks
Market volatility and external news could impact the price unexpectedly.
1 Week Prediction
Target: April 25, 2025$4.7
$4.675
$4.75
$4.65
Description
The stock is expected to maintain its upward momentum, supported by a bullish MACD crossover. The RSI is approaching overbought territory, indicating potential for a pullback. However, the overall trend remains positive.
Analysis
The stock has been trending upward, with key resistance at 5.10. Recent candlestick patterns show bullish sentiment, but the RSI nearing overbought levels suggests caution. Volume trends indicate healthy trading activity.
Confidence Level
Potential Risks
Potential market corrections and economic data releases could affect the stock's performance.
1 Month Prediction
Target: May 25, 2025$4.85
$4.75
$4.9
$4.7
Description
The stock is likely to continue its upward trajectory, supported by bullish market sentiment and strong technical indicators. Fibonacci retracement levels suggest potential resistance at 4.90, but the overall trend remains bullish.
Analysis
The stock has shown a strong bullish trend with significant support at 4.50. Technical indicators like MACD and moving averages support further upward movement. However, external factors could introduce volatility.
Confidence Level
Potential Risks
Economic indicators and geopolitical events could introduce volatility.
3 Months Prediction
Target: July 17, 2025$5.2
$5.1
$5.3
$4.9
Description
Long-term indicators suggest a bullish outlook, with potential for the stock to reach new highs. However, the RSI indicates overbought conditions, which may lead to corrections. Market sentiment remains optimistic.
Analysis
The stock has shown resilience with a bullish trend, but recent volatility raises concerns. Key resistance levels are at 5.10, while support is around 4.50. The overall market sentiment is cautiously optimistic, but external factors could impact performance.
Confidence Level
Potential Risks
Long-term predictions are subject to market fluctuations and economic changes.