HGF Trading Predictions
1 Day Prediction
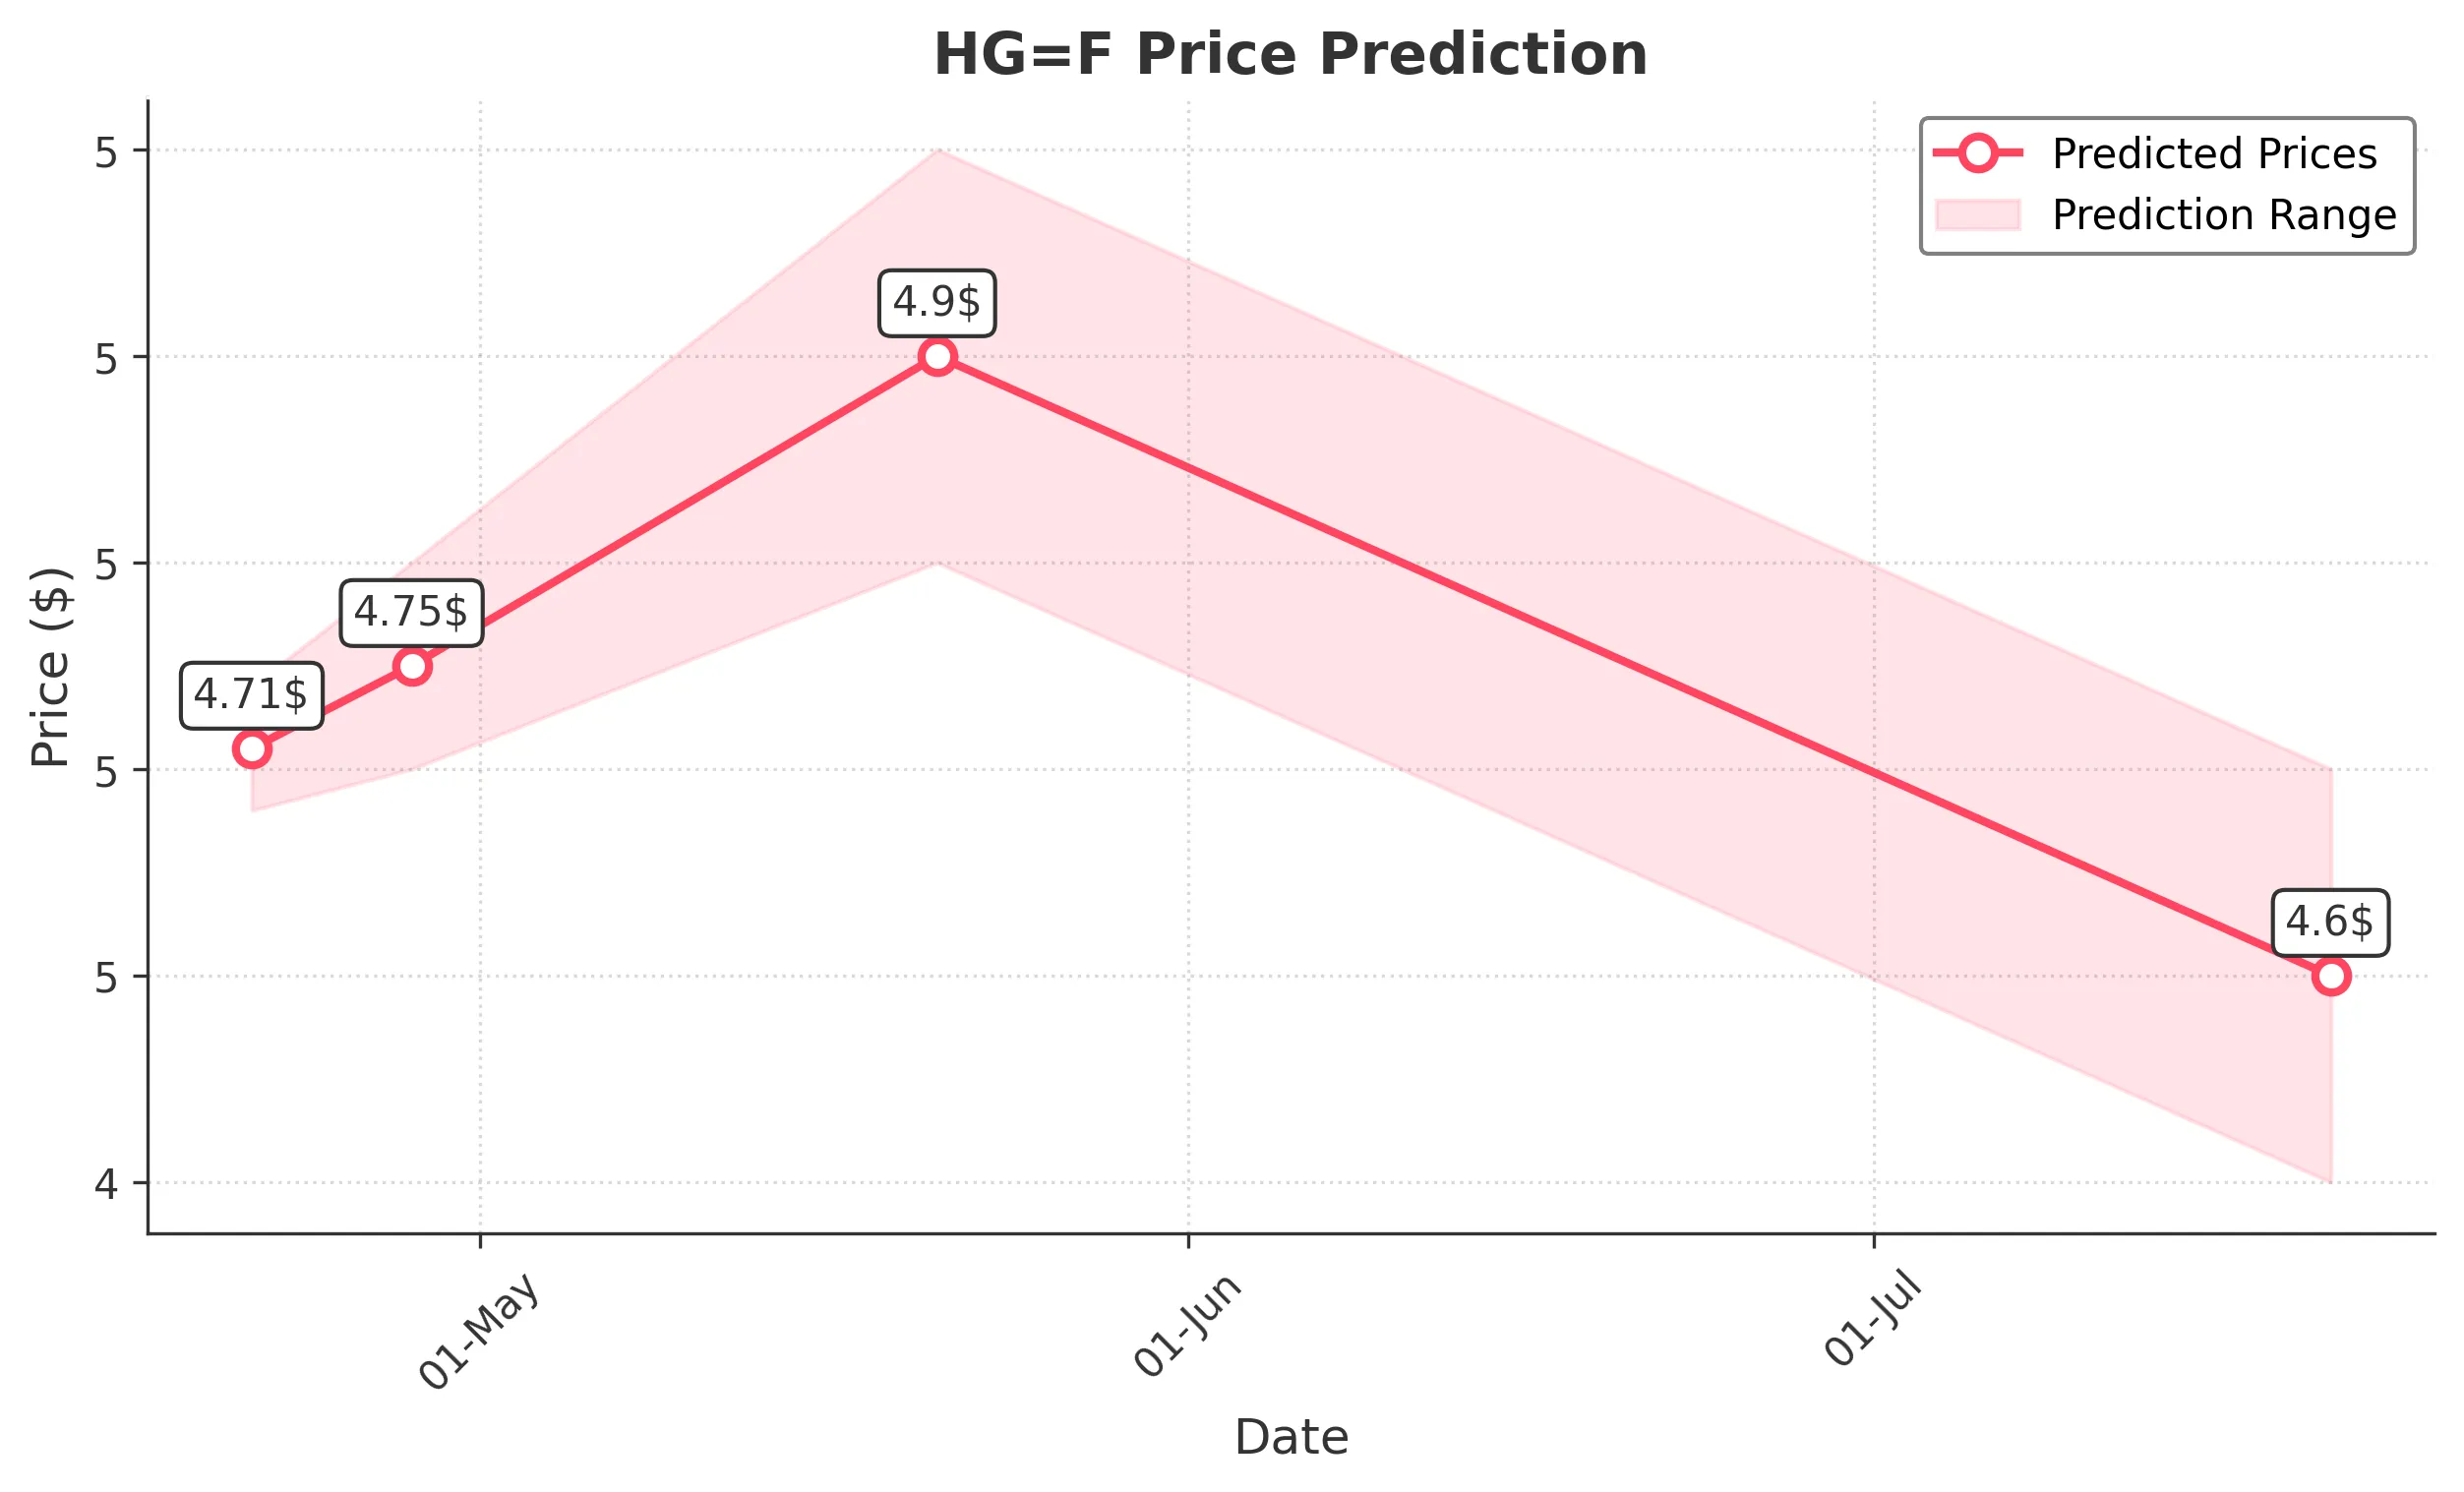
Target: April 21, 2025$4.71
$4.695
$4.74
$4.68
Description
The stock shows a slight bullish trend with a recent close above the 20-day moving average. RSI indicates overbought conditions, suggesting a potential pullback. However, the overall sentiment remains positive, supported by recent volume spikes.
Analysis
Over the past 3 months, HG=F has shown a bullish trend with significant support around 4.60 and resistance near 5.10. The MACD is bullish, but the RSI indicates overbought conditions. Volume has been inconsistent, with spikes suggesting speculative interest. External factors like market sentiment and macroeconomic data could influence future movements.
Confidence Level
Potential Risks
Potential for a reversal exists due to overbought RSI levels and recent volatility.
1 Week Prediction
Target: April 28, 2025$4.75
$4.71
$4.8
$4.7
Description
The stock is expected to maintain its upward momentum, supported by bullish candlestick patterns and a favorable MACD crossover. However, the RSI remains elevated, indicating potential profit-taking could occur.
Analysis
The stock has been in a bullish phase, with key support at 4.60 and resistance at 5.10. The recent price action shows bullish engulfing patterns, but the RSI suggests caution. Volume trends indicate interest, but macroeconomic factors could introduce volatility.
Confidence Level
Potential Risks
Market volatility and profit-taking could lead to unexpected price corrections.
1 Month Prediction
Target: May 21, 2025$4.9
$4.75
$5
$4.8
Description
A continued bullish trend is anticipated, with the stock potentially reaching the 5.00 resistance level. The MACD remains positive, but the RSI indicates overbought conditions, suggesting caution for potential pullbacks.
Analysis
The stock has shown a strong upward trend, with significant resistance at 5.10. The MACD is bullish, but the RSI indicates overbought conditions. Volume patterns suggest speculative interest, but macroeconomic influences could lead to volatility.
Confidence Level
Potential Risks
External market conditions and economic data releases could impact the stock's performance.
3 Months Prediction
Target: July 21, 2025$4.6
$4.9
$4.7
$4.5
Description
A bearish correction is expected as the stock may retrace from recent highs. The RSI indicates overbought conditions, and potential profit-taking could lead to a decline. Support at 4.60 will be critical.
Analysis
The stock has experienced a bullish trend, but signs of exhaustion are evident. Key support is at 4.60, while resistance remains at 5.10. The MACD is showing signs of divergence, and the RSI is overbought, indicating potential for a correction.
Confidence Level
Potential Risks
Market sentiment and economic conditions could lead to unexpected price movements.