HGF Trading Predictions
1 Day Prediction
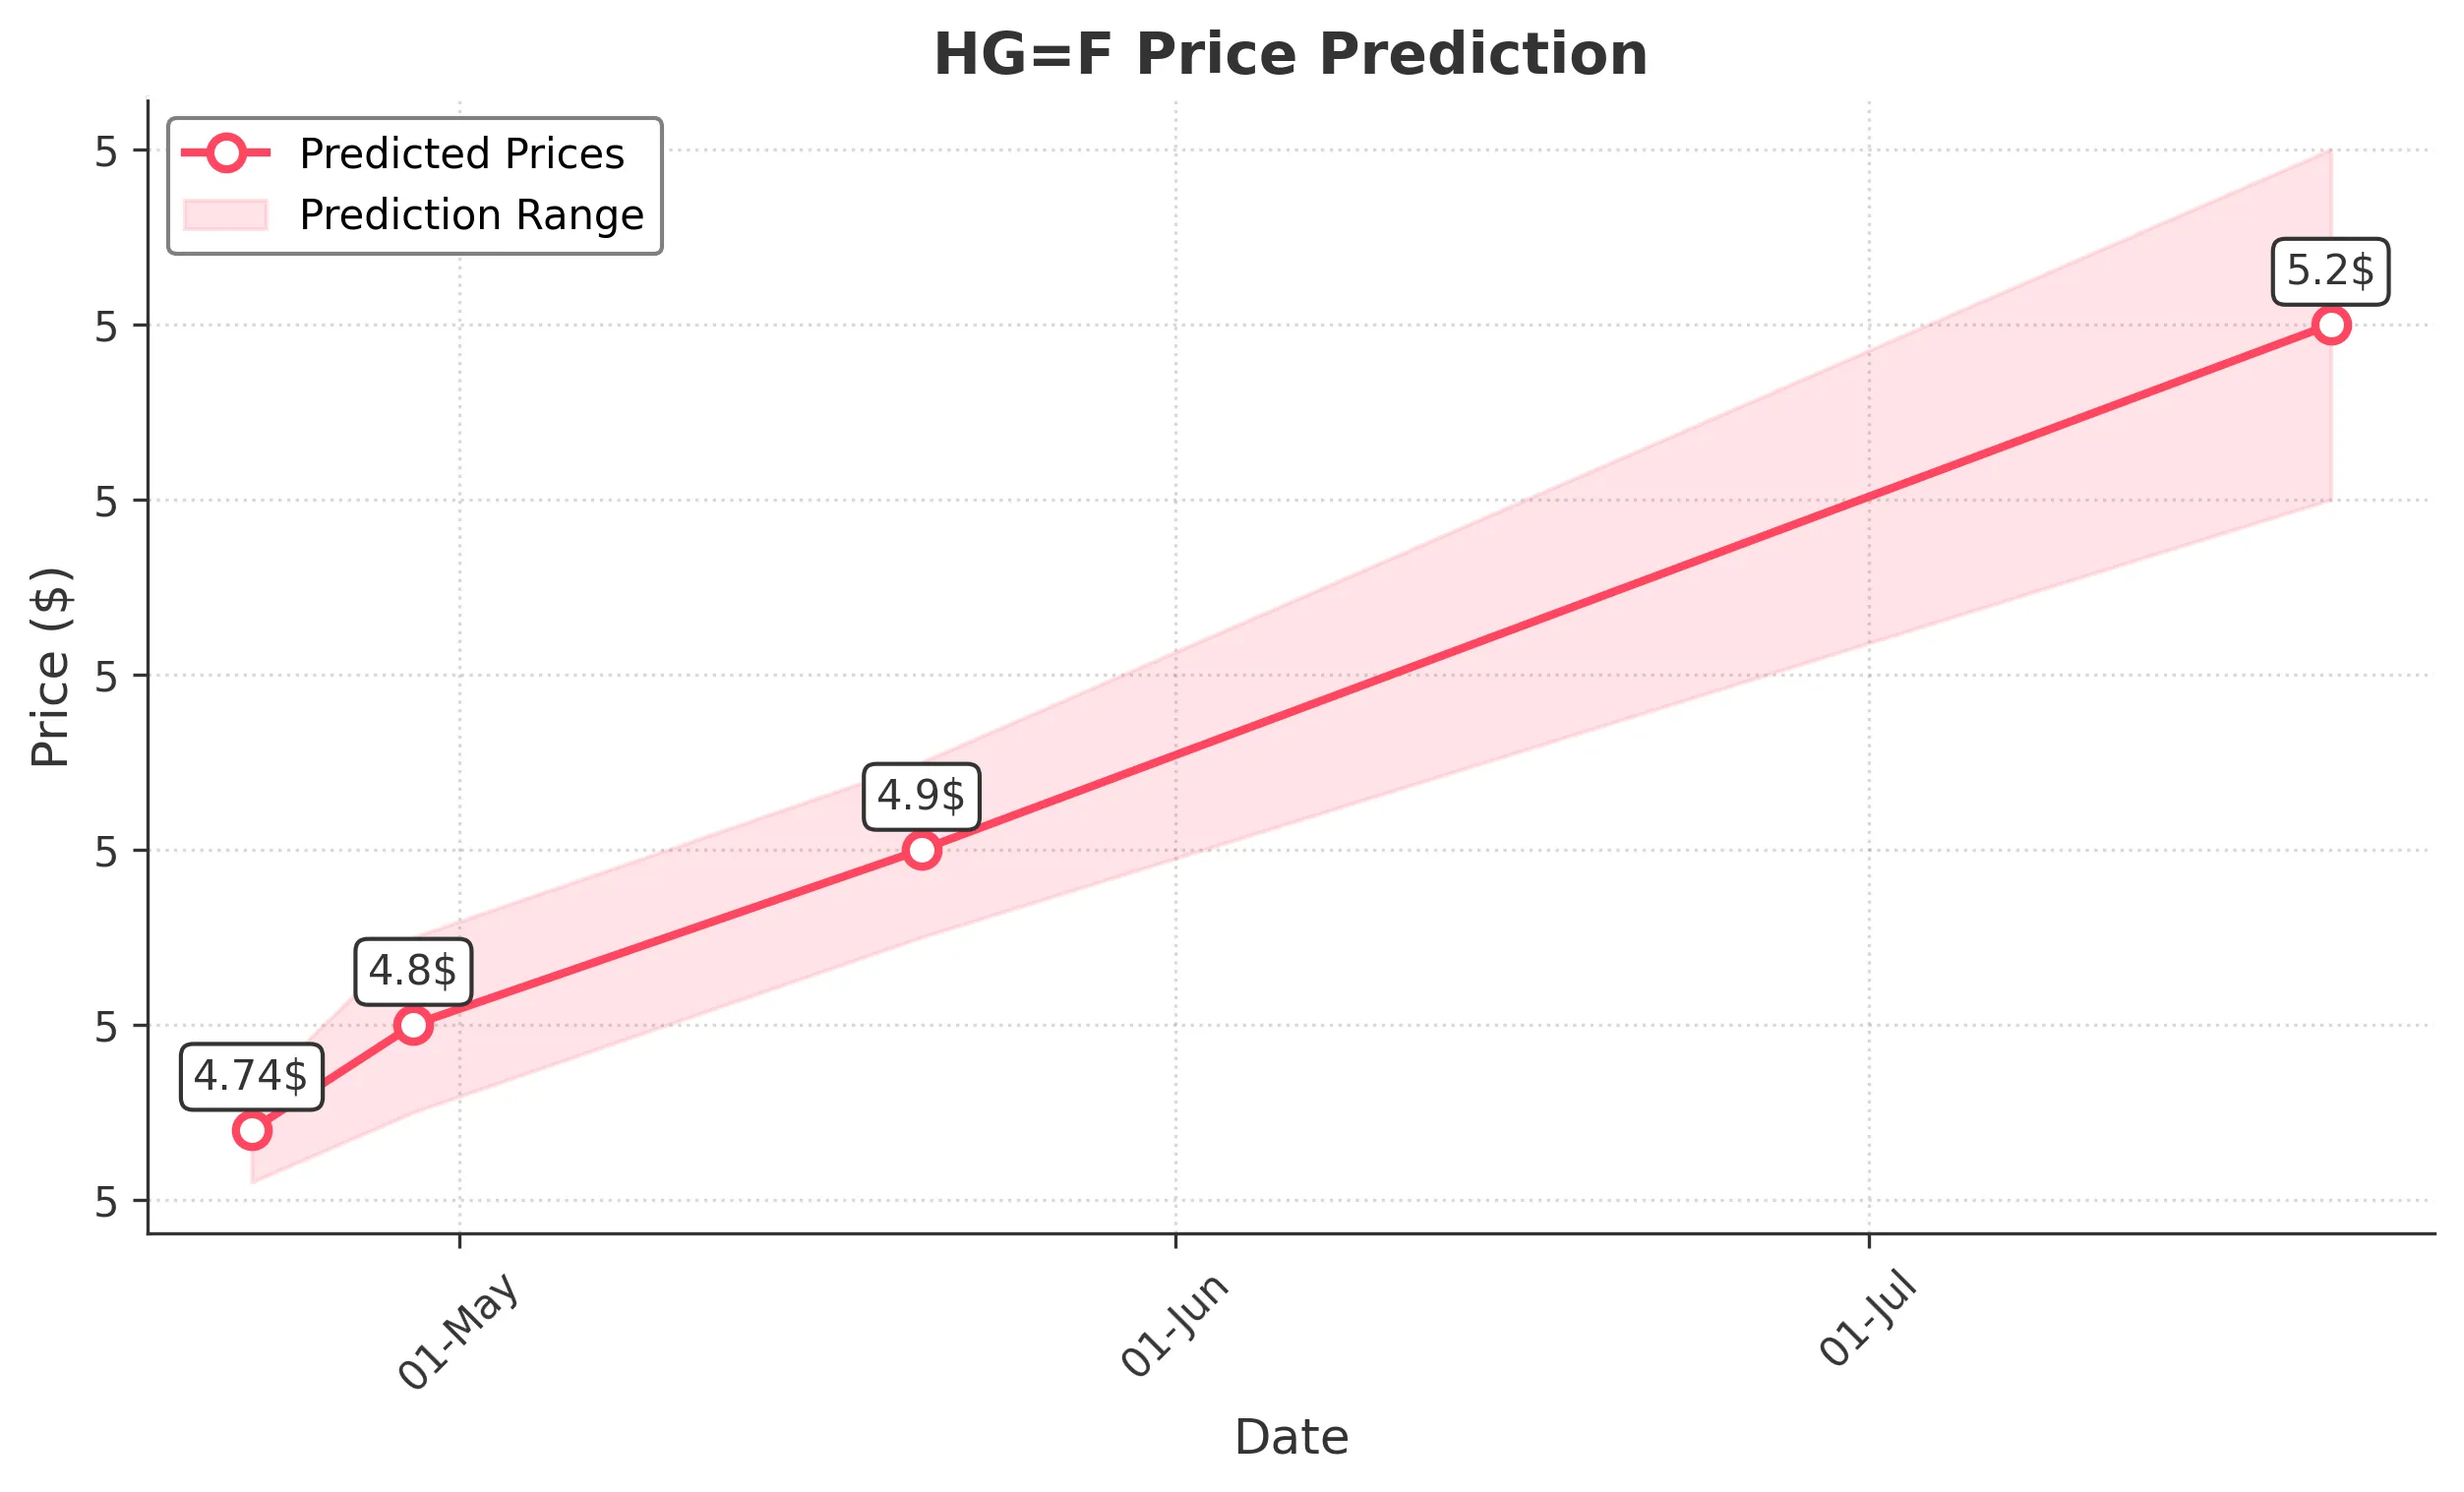
Target: April 22, 2025$4.74
$4.735
$4.76
$4.71
Description
The stock shows a slight bullish trend with recent higher lows and higher highs. The RSI is approaching overbought levels, indicating potential for a pullback. However, the MACD remains positive, suggesting upward momentum.
Analysis
Over the past 3 months, HG=F has shown a bullish trend with significant support at 4.6000 and resistance around 4.8000. The recent price action indicates a consolidation phase, with volume spikes suggesting increased interest. Technical indicators like the MACD and moving averages support a bullish outlook, but caution is warranted due to overbought conditions.
Confidence Level
Potential Risks
Potential market volatility and profit-taking could lead to a downward correction.
1 Week Prediction
Target: April 29, 2025$4.8
$4.77
$4.85
$4.75
Description
The stock is expected to continue its upward trajectory, supported by bullish sentiment and positive technical indicators. The recent breakout above resistance levels suggests further gains, although overbought conditions may lead to short-term corrections.
Analysis
The stock has been in a bullish trend, with key support at 4.6000 and resistance at 4.8000. The MACD indicates strong momentum, while the RSI suggests caution as it approaches overbought territory. Volume patterns show increased interest, but external factors could introduce volatility.
Confidence Level
Potential Risks
Market sentiment could shift due to macroeconomic news or earnings reports, impacting the stock's performance.
1 Month Prediction
Target: May 21, 2025$4.9
$4.87
$4.95
$4.85
Description
The stock is likely to maintain its upward trend, driven by strong market sentiment and positive technical indicators. However, the potential for profit-taking and market corrections remains a risk.
Analysis
In the last three months, HG=F has shown a clear bullish trend with significant support at 4.6000. The MACD and moving averages indicate continued upward momentum, but the RSI suggests caution as it nears overbought levels. Volume analysis shows increased trading activity, indicating strong interest.
Confidence Level
Potential Risks
Unforeseen macroeconomic events or changes in market sentiment could lead to volatility.
3 Months Prediction
Target: July 21, 2025$5.2
$5.15
$5.3
$5.1
Description
The stock is expected to continue its bullish trend, supported by strong fundamentals and positive market sentiment. However, potential market corrections and external factors could introduce volatility.
Analysis
Over the past three months, HG=F has demonstrated a strong bullish trend with key support at 4.6000 and resistance at 5.2000. The MACD and moving averages indicate positive momentum, while the RSI suggests caution. Volume patterns indicate strong interest, but external factors could impact future performance.
Confidence Level
Potential Risks
Long-term predictions are subject to greater uncertainty due to potential market shifts and economic changes.