HGF Trading Predictions
1 Day Prediction
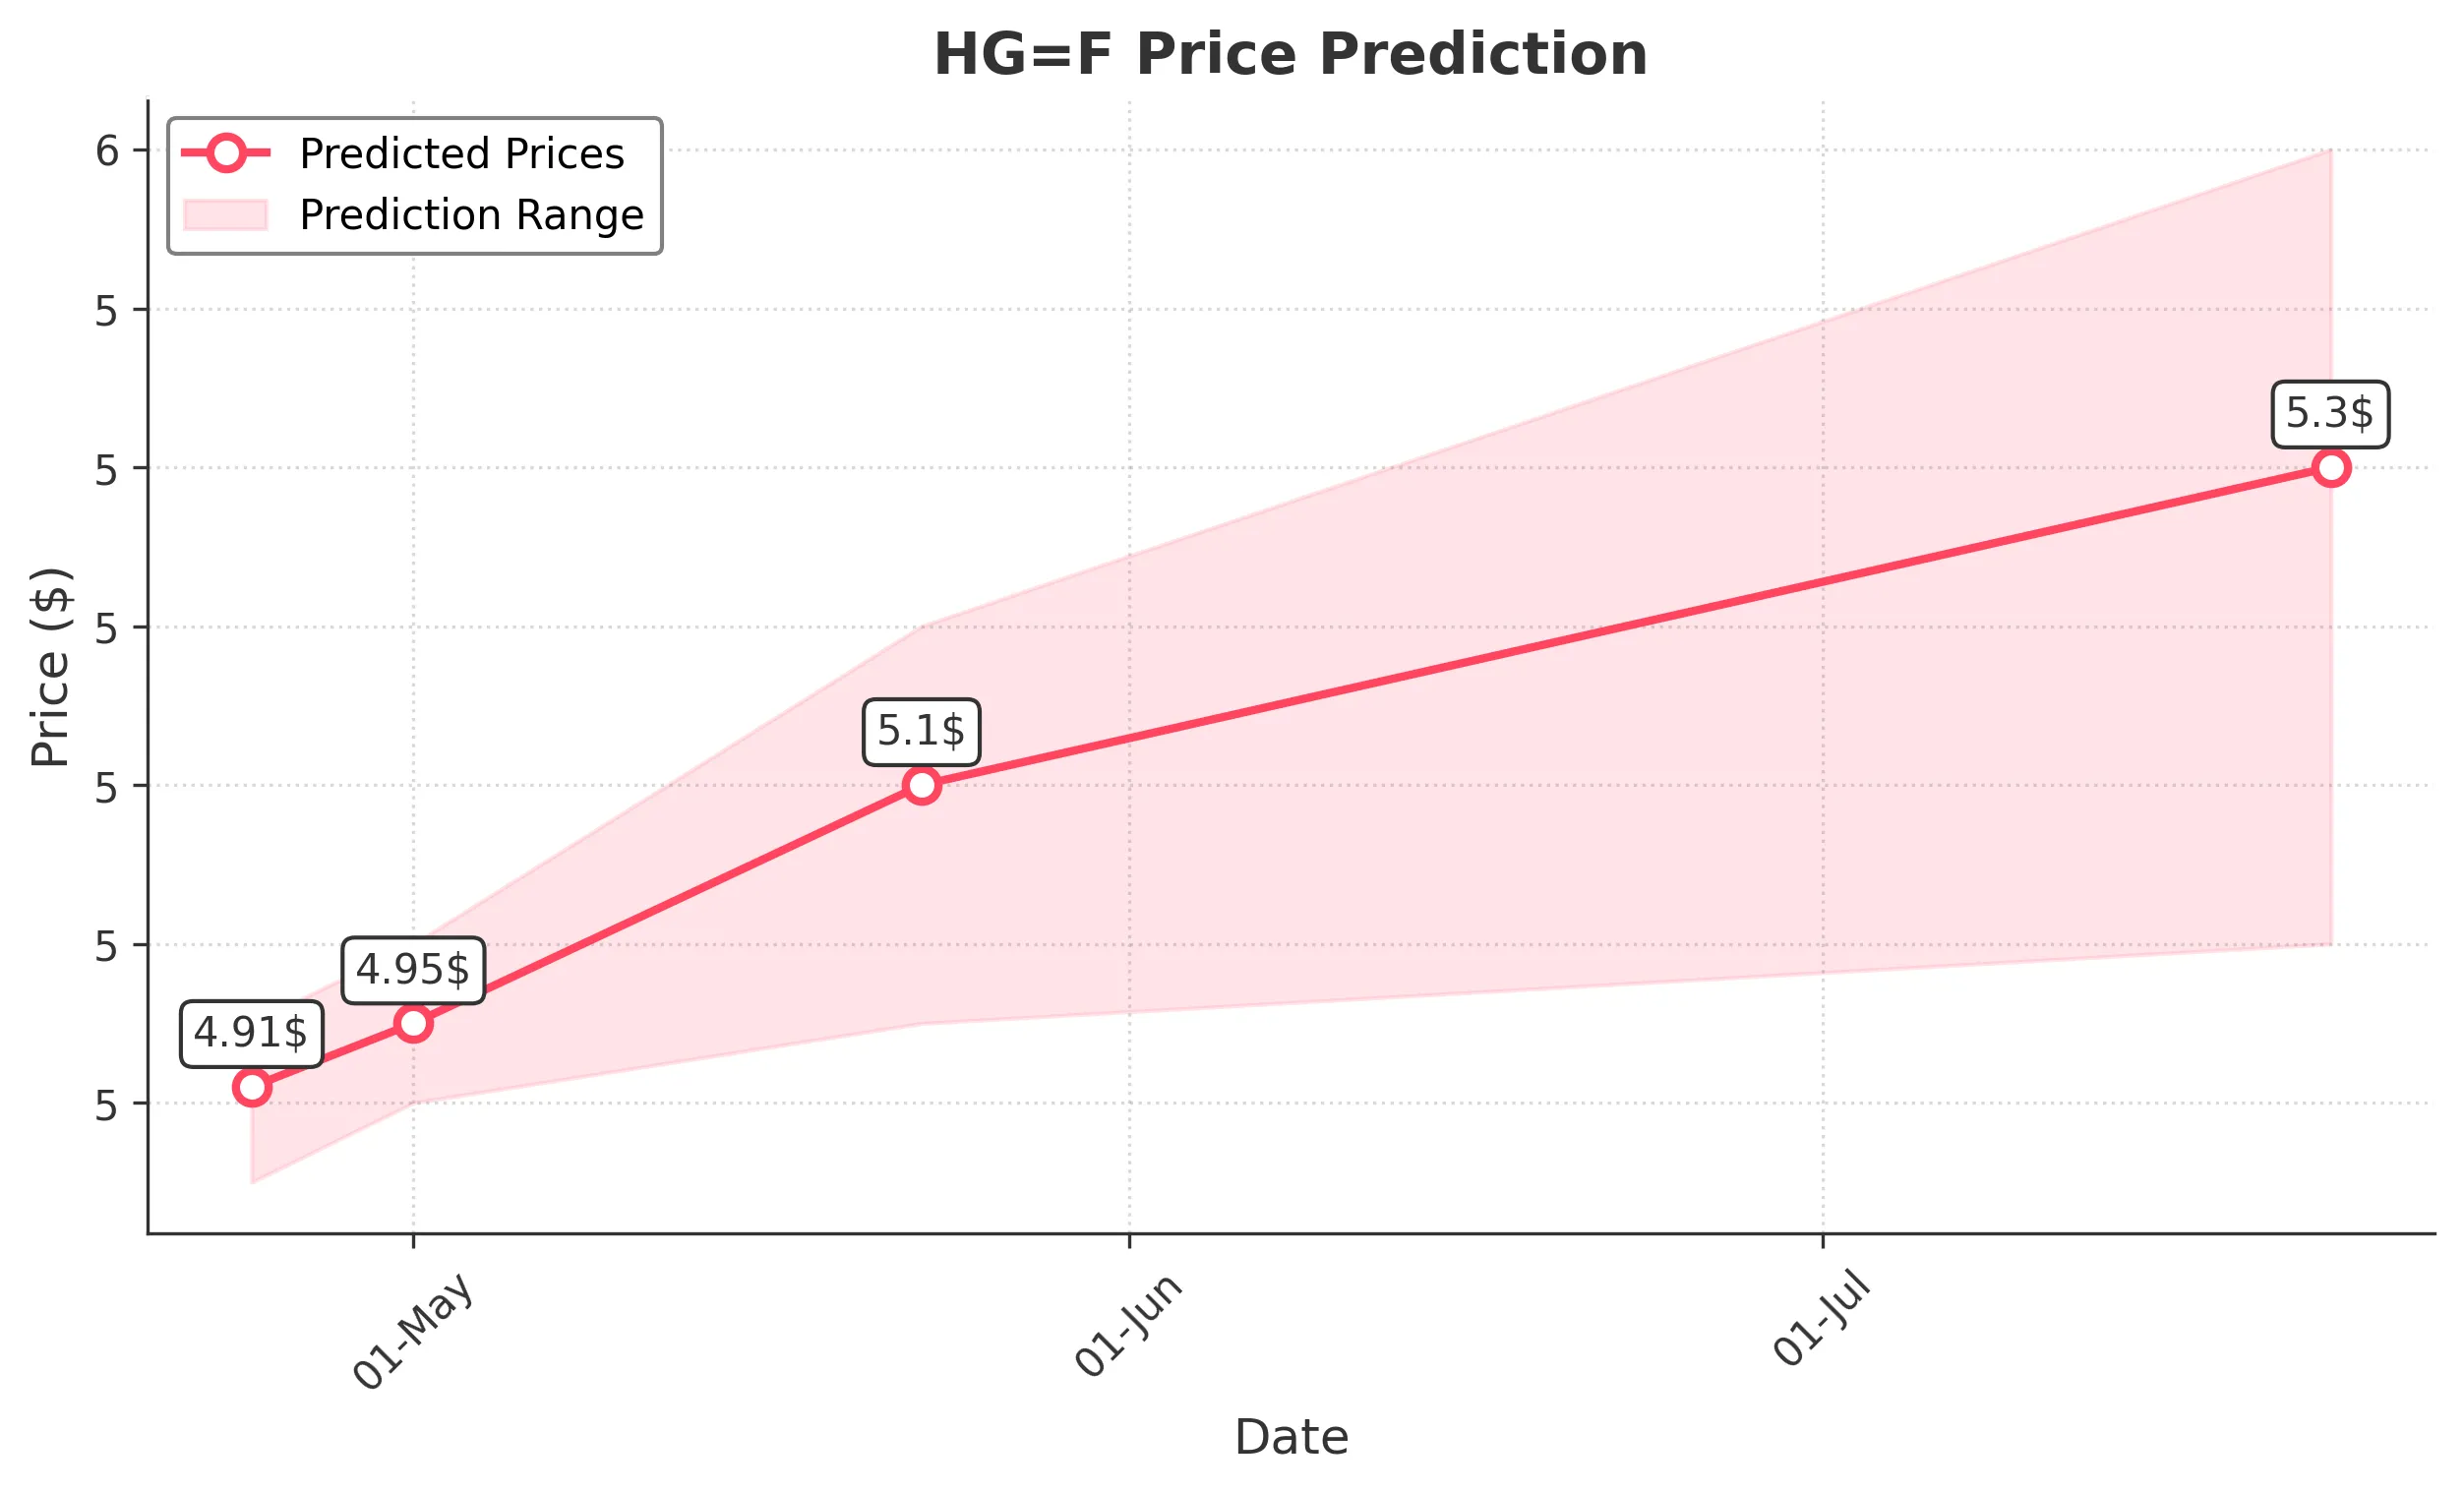
Target: April 24, 2025$4.91
$4.895
$4.95
$4.85
Description
The stock shows a bullish trend with a recent close above the 20-day moving average. RSI indicates overbought conditions, suggesting a potential pullback. However, strong volume on the last trading day supports upward momentum.
Analysis
Over the past 3 months, HG=F has shown a bullish trend with significant support at 4.50 and resistance around 5.00. Recent candlestick patterns indicate bullish sentiment, but RSI nearing overbought levels raises concerns about a possible correction.
Confidence Level
Potential Risks
Potential market volatility and profit-taking could lead to a price drop.
1 Week Prediction
Target: May 1, 2025$4.95
$4.91
$5
$4.9
Description
The stock is expected to continue its upward trajectory, supported by recent bullish candlestick patterns. However, the RSI indicates potential overbought conditions, which may lead to a short-term pullback.
Analysis
The stock has been trending upward, with key support at 4.80 and resistance at 5.00. The MACD shows bullish momentum, but the recent high volume suggests potential profit-taking could create volatility.
Confidence Level
Potential Risks
Market sentiment could shift due to macroeconomic news, impacting the stock's performance.
1 Month Prediction
Target: May 23, 2025$5.1
$5
$5.2
$4.95
Description
The stock is likely to break through resistance at 5.00, driven by strong bullish sentiment and positive market conditions. However, the RSI indicates a risk of overextension, suggesting caution.
Analysis
The stock has shown a strong bullish trend, with significant support at 4.80. The MACD and moving averages indicate continued upward momentum, but the high RSI suggests a potential correction could occur.
Confidence Level
Potential Risks
Unforeseen macroeconomic events could impact market sentiment and lead to volatility.
3 Months Prediction
Target: July 23, 2025$5.3
$5.2
$5.5
$5
Description
Long-term bullish sentiment is expected to prevail, with potential for further gains as the stock breaks through key resistance levels. However, macroeconomic factors could introduce volatility.
Analysis
The stock has maintained a bullish trend, with key support at 5.00 and resistance at 5.50. The overall market sentiment is positive, but external economic factors could introduce risks to this outlook.
Confidence Level
Potential Risks
Economic downturns or changes in market sentiment could lead to unexpected price declines.