HGF Trading Predictions
1 Day Prediction
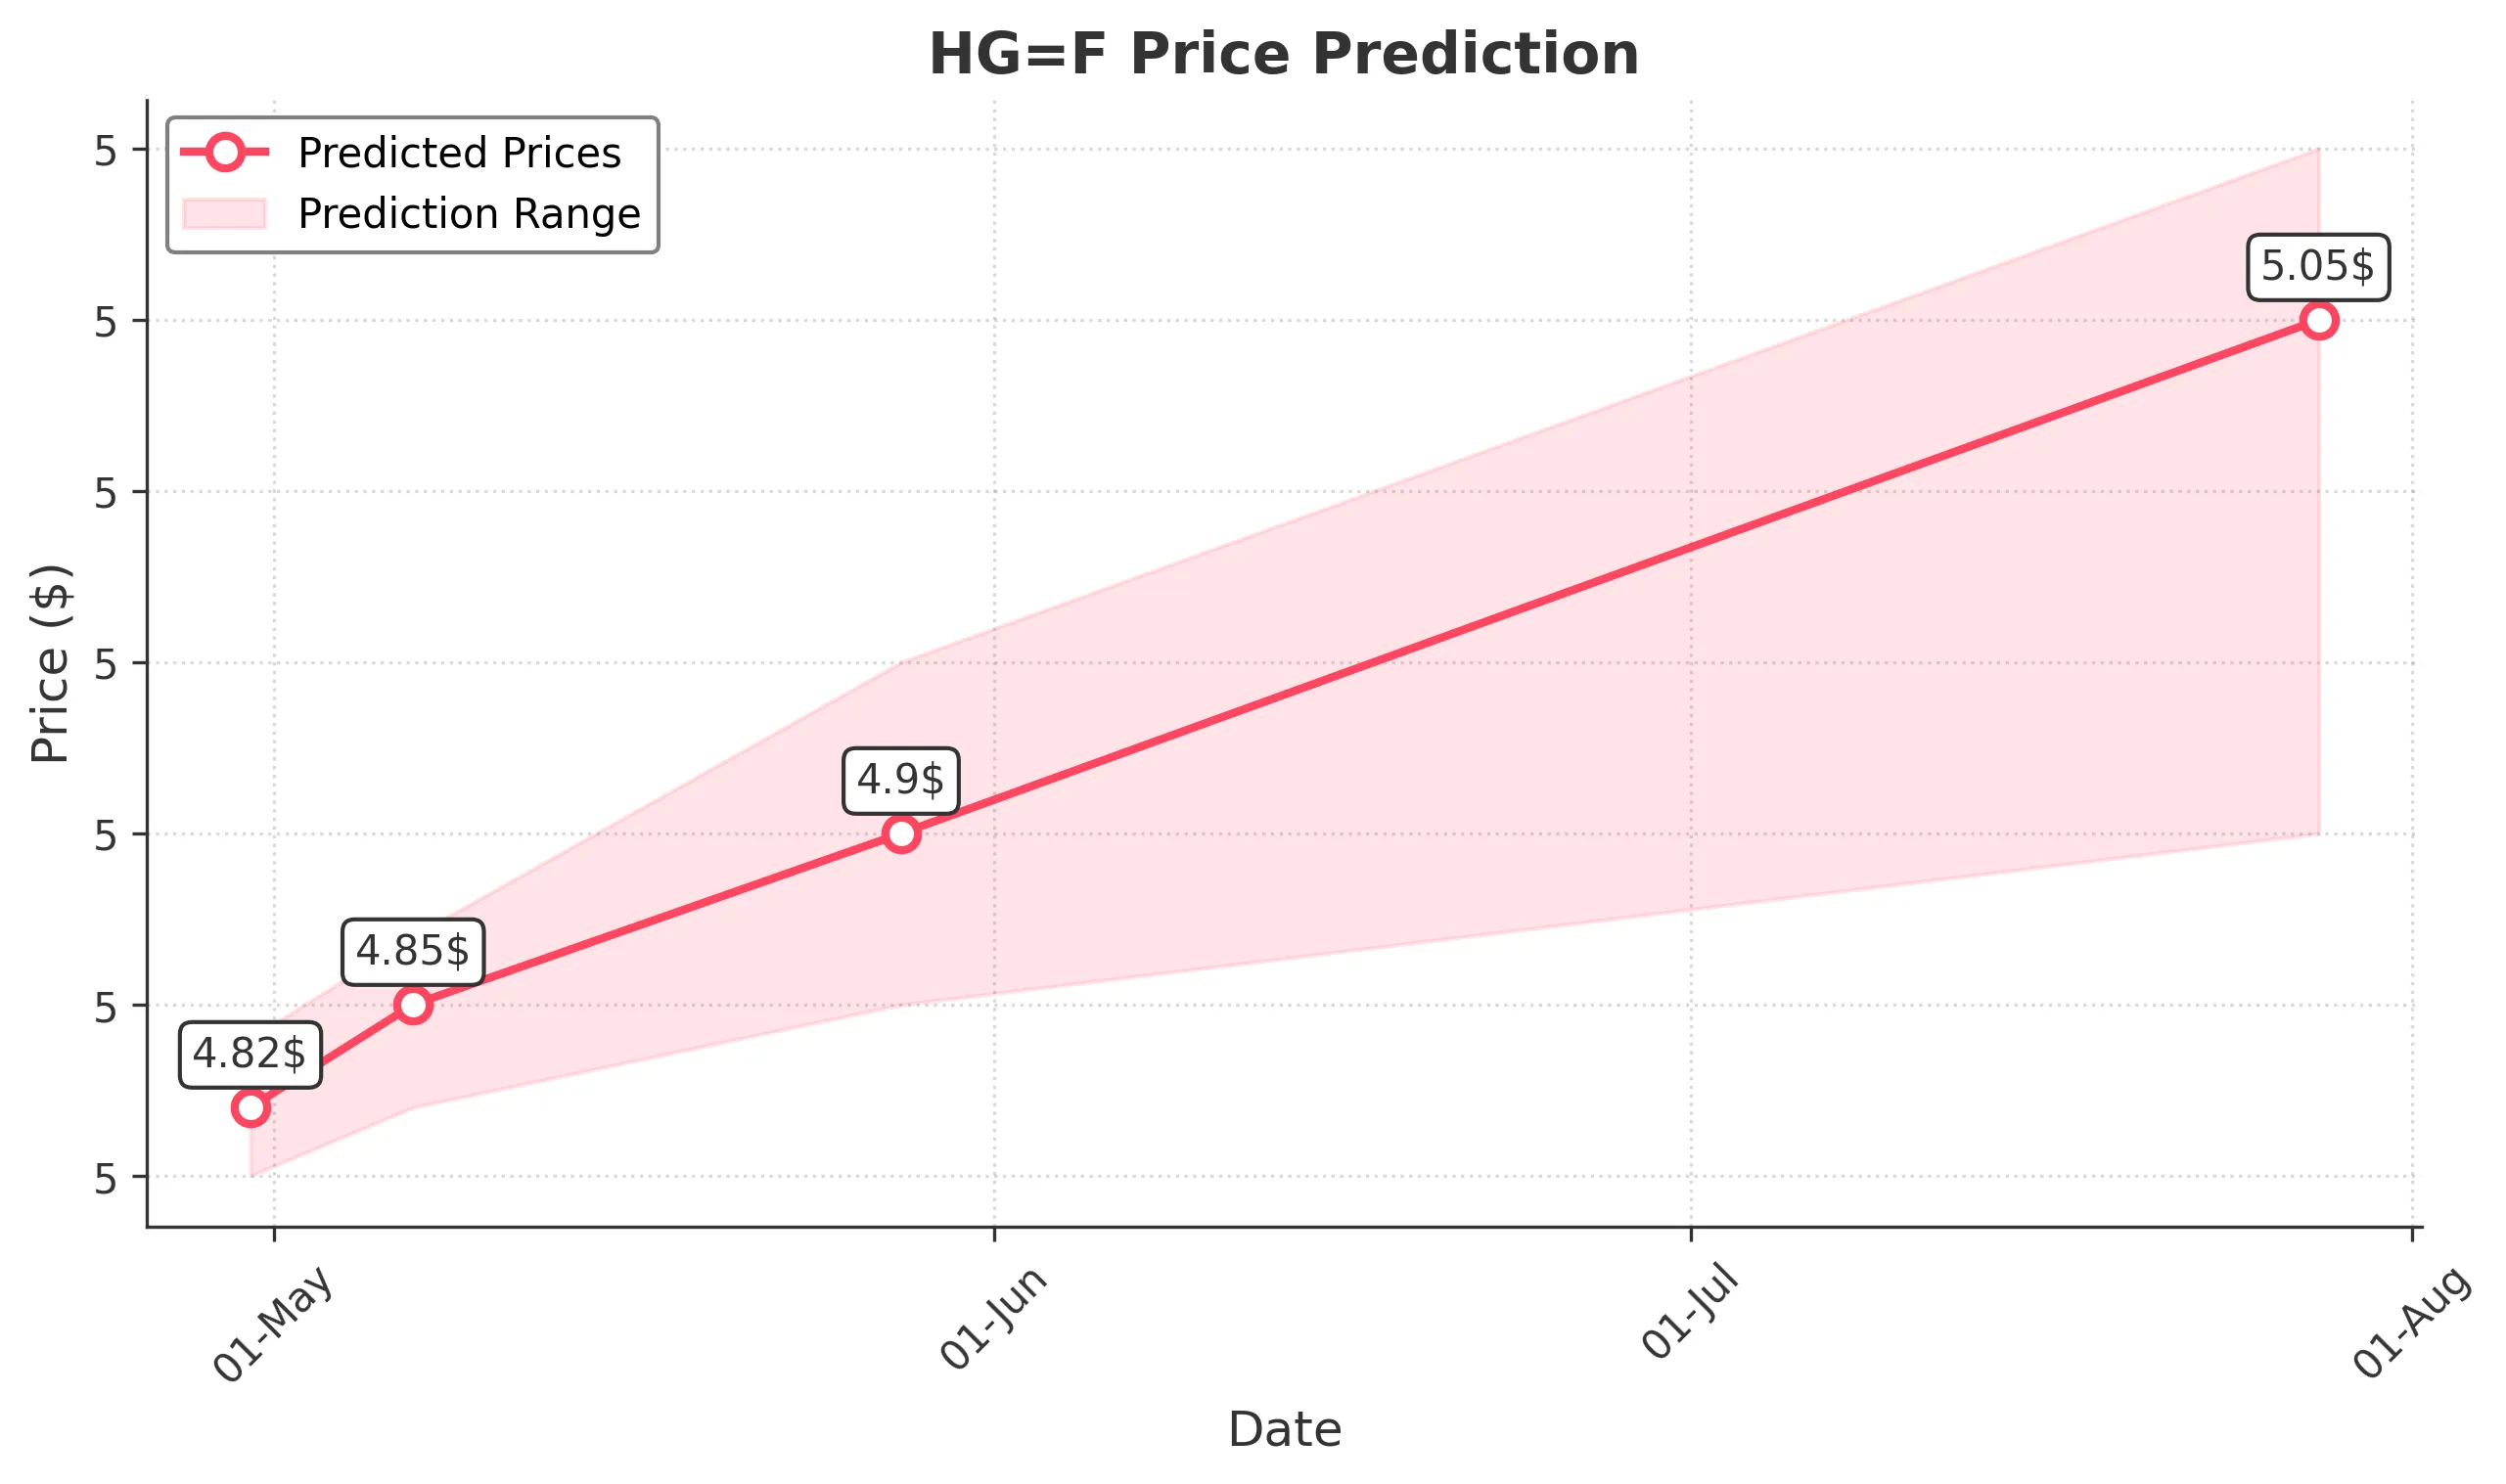
Target: April 30, 2025$4.82
$4.83
$4.84
$4.8
Description
The stock shows a slight bullish trend with a recent close of 4.8270. The RSI is approaching overbought levels, indicating potential for a pullback. However, the MACD remains positive, suggesting upward momentum. Volume is expected to be moderate.
Analysis
Over the past 3 months, HG=F has shown a bullish trend with significant support around 4.80 and resistance near 5.00. The recent price action indicates a consolidation phase, with the RSI nearing overbought territory. Volume has been stable, but spikes were noted during key price movements.
Confidence Level
Potential Risks
Potential for a reversal exists if market sentiment shifts or if macroeconomic news impacts trading.
1 Week Prediction
Target: May 7, 2025$4.85
$4.84
$4.87
$4.82
Description
The stock is expected to maintain its upward trajectory, supported by recent bullish candlestick patterns. The MACD remains positive, and the Bollinger Bands indicate potential for a breakout. However, the RSI suggests caution as it approaches overbought levels.
Analysis
The stock has been in a bullish trend, with key support at 4.80 and resistance at 5.00. Recent price action shows a series of higher lows, indicating strength. However, the RSI nearing overbought levels raises concerns about a potential pullback.
Confidence Level
Potential Risks
Market volatility and external economic factors could lead to unexpected price movements.
1 Month Prediction
Target: May 28, 2025$4.9
$4.87
$4.95
$4.85
Description
The stock is projected to continue its upward trend, supported by strong bullish momentum. The MACD remains positive, and the price is expected to test resistance levels. However, the RSI indicates potential overbought conditions, suggesting caution.
Analysis
In the last three months, HG=F has shown a clear bullish trend with significant support at 4.80. The recent price action indicates a strong upward momentum, but the RSI nearing overbought levels suggests a potential for a pullback. Volume patterns indicate healthy trading activity.
Confidence Level
Potential Risks
Economic data releases or geopolitical events could impact market sentiment and lead to volatility.
3 Months Prediction
Target: July 28, 2025$5.05
$4.95
$5.1
$4.9
Description
The stock is expected to reach new highs, driven by continued bullish sentiment and strong technical indicators. The MACD remains bullish, and the price is likely to break through resistance levels. However, caution is advised as the RSI may indicate overbought conditions.
Analysis
Over the past three months, HG=F has demonstrated a strong bullish trend with key support at 4.80 and resistance at 5.00. The MACD and moving averages indicate upward momentum, but the RSI nearing overbought levels suggests potential for a pullback. Volume patterns have been stable, indicating healthy trading activity.
Confidence Level
Potential Risks
Market corrections or unexpected news could lead to volatility and impact the price trajectory.