HGF Trading Predictions
1 Day Prediction
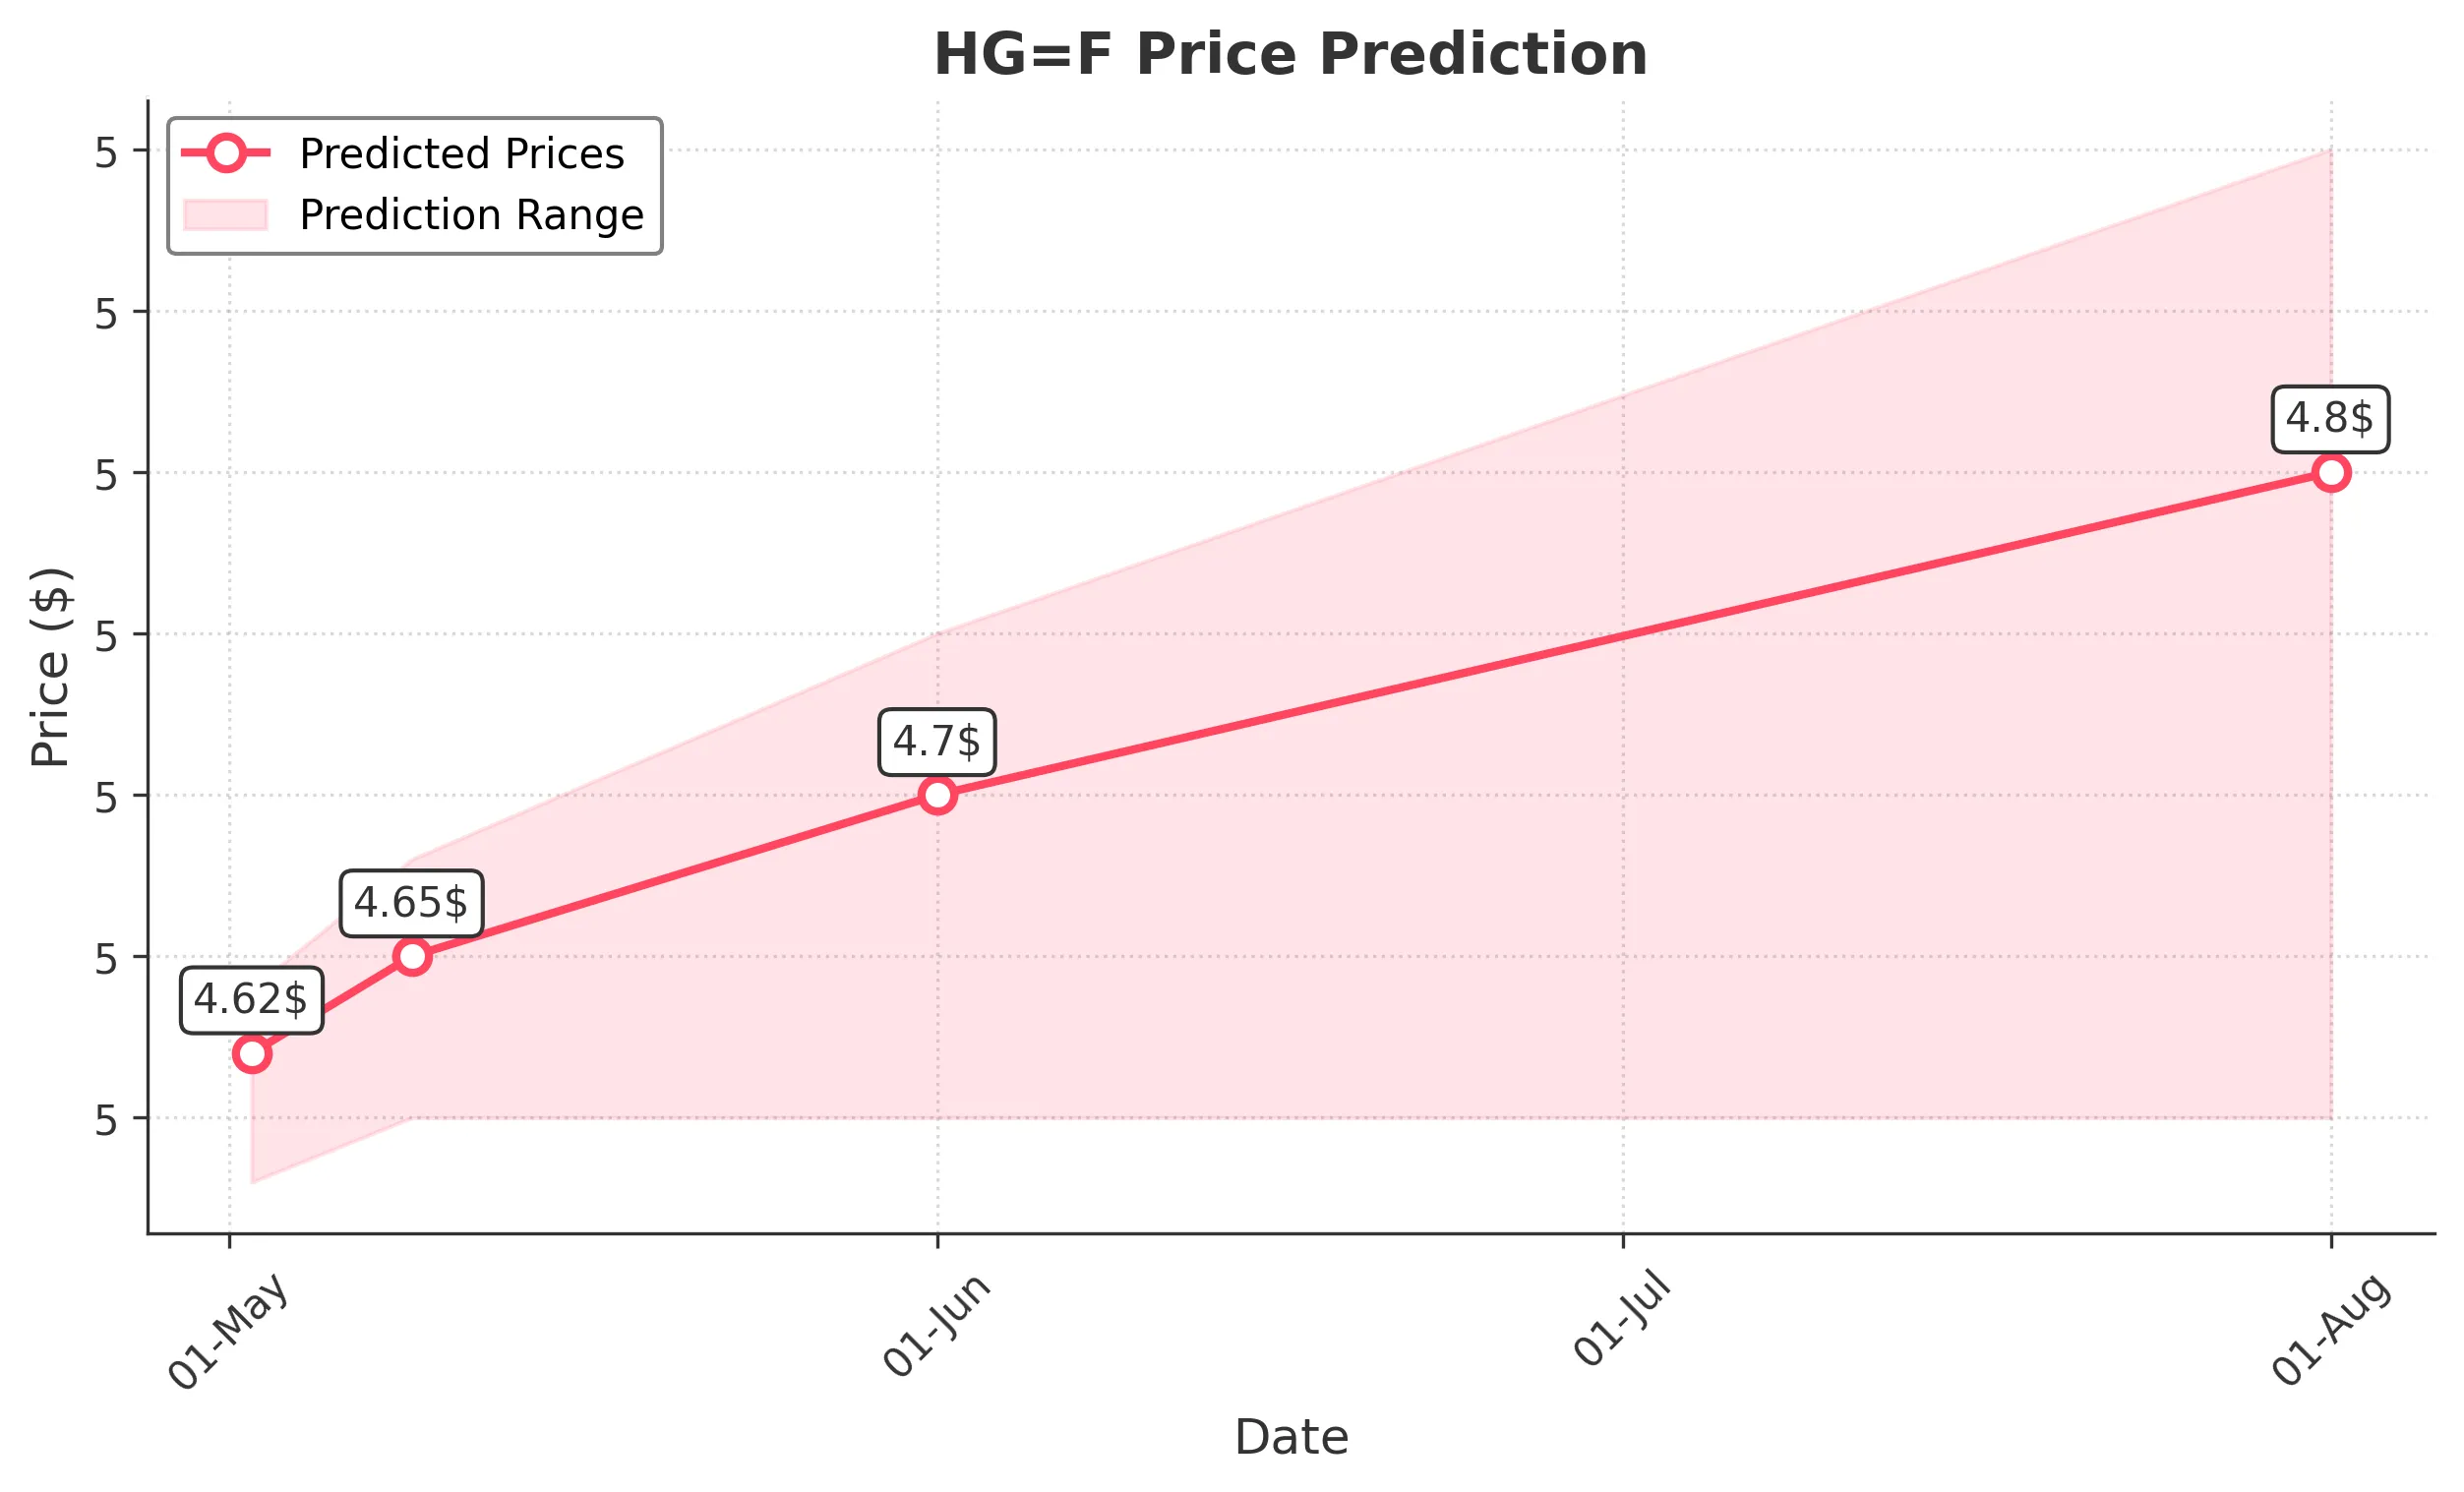
Target: May 2, 2025$4.62
$4.61
$4.64
$4.58
Description
The stock shows a bullish trend with a recent upward movement. The RSI is approaching overbought levels, indicating potential for a pullback. However, the MACD is positive, suggesting continued momentum. Expect slight fluctuations around the current price.
Analysis
Over the past 3 months, HG=F has shown a bullish trend with significant support at 4.50 and resistance around 5.00. The recent price action indicates a strong upward momentum, but the RSI nearing overbought levels suggests caution. Volume has been stable, with occasional spikes indicating interest.
Confidence Level
Potential Risks
Potential for a reversal exists if market sentiment shifts or if external news impacts trading.
1 Week Prediction
Target: May 9, 2025$4.65
$4.62
$4.68
$4.6
Description
The stock is expected to continue its upward trajectory, supported by positive MACD and bullish candlestick patterns. However, the RSI indicates potential overbought conditions, which could lead to a pullback. Watch for volume trends to confirm strength.
Analysis
The stock has maintained a bullish trend with key support at 4.50. The recent price action shows a series of higher highs and higher lows, indicating strong buying interest. However, the RSI suggests caution as it approaches overbought territory, and any negative news could trigger a correction.
Confidence Level
Potential Risks
Market volatility and external economic factors could impact the stock's performance, leading to unexpected price movements.
1 Month Prediction
Target: June 1, 2025$4.7
$4.65
$4.75
$4.6
Description
The stock is likely to maintain its upward trend, supported by bullish technical indicators. However, the RSI indicates potential overbought conditions, which may lead to a correction. Monitor for any changes in market sentiment that could affect momentum.
Analysis
The stock has shown a consistent bullish trend with significant support at 4.50. The MACD remains positive, and recent volume spikes indicate strong buying interest. However, the RSI nearing overbought levels suggests a potential pullback could occur if market conditions change.
Confidence Level
Potential Risks
Unforeseen macroeconomic events or shifts in market sentiment could lead to volatility and impact the stock's performance.
3 Months Prediction
Target: August 1, 2025$4.8
$4.7
$4.9
$4.6
Description
The stock is expected to trend upward, supported by strong fundamentals and positive market sentiment. However, the RSI indicates potential overbought conditions, which could lead to volatility. Watch for external economic factors that may influence price.
Analysis
Over the past three months, HG=F has shown a strong bullish trend with key support at 4.50 and resistance around 5.00. The MACD remains positive, indicating upward momentum, but the RSI suggests caution as it approaches overbought levels. External economic factors could introduce volatility.
Confidence Level
Potential Risks
Long-term predictions are subject to greater uncertainty due to potential market shifts and economic changes that could impact investor sentiment.