HGF Trading Predictions
1 Day Prediction
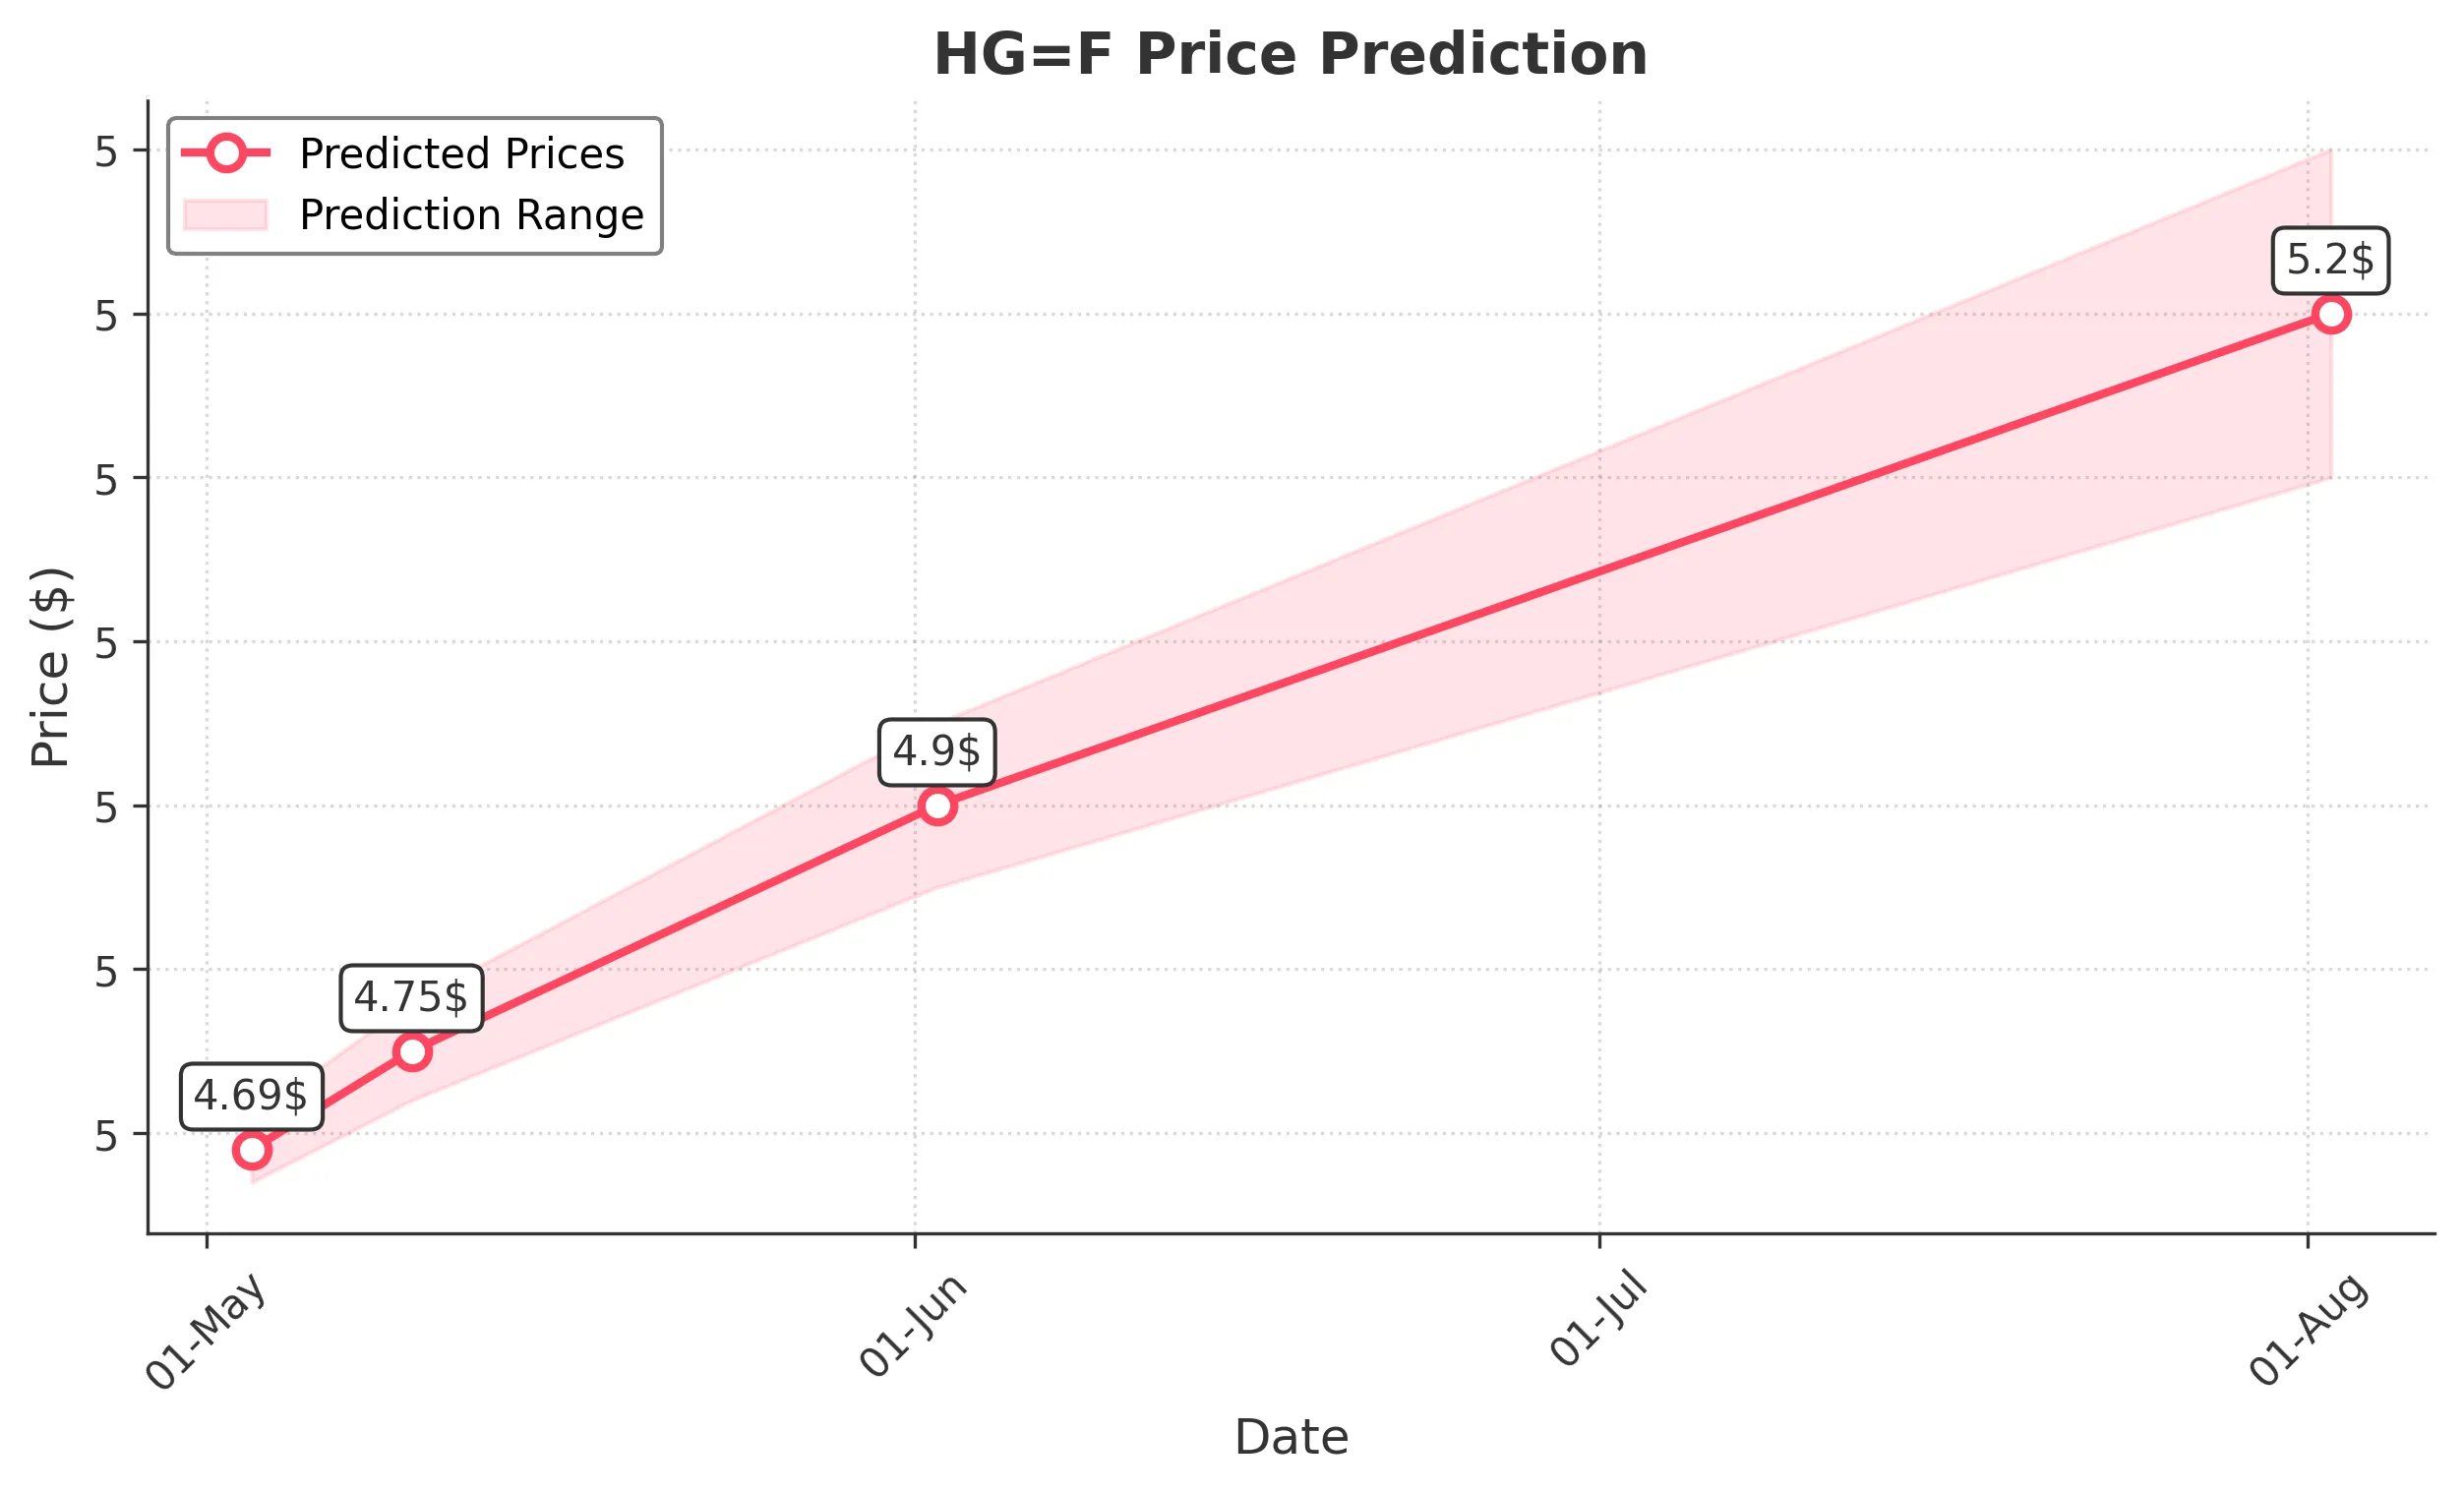
Target: May 3, 2025$4.69
$4.685
$4.71
$4.67
Description
The stock shows a bullish trend with a recent upward movement. The RSI is approaching overbought levels, indicating potential for a pullback. However, the MACD remains positive, suggesting continued upward momentum. Volume is expected to be moderate.
Analysis
Over the past 3 months, HG=F has shown a bullish trend with significant upward movements. Key resistance is around 4.70, while support is at 4.50. The MACD and moving averages indicate bullish momentum, but RSI suggests caution due to overbought conditions.
Confidence Level
Potential Risks
Potential market volatility and profit-taking could lead to a price pullback.
1 Week Prediction
Target: May 10, 2025$4.75
$4.74
$4.78
$4.72
Description
The stock is expected to continue its upward trend, supported by positive market sentiment and strong technical indicators. However, the RSI indicates potential overbought conditions, which may lead to short-term corrections.
Analysis
The stock has been on a bullish trajectory, with recent highs indicating strong buying interest. Key resistance at 4.80 may pose challenges, while support at 4.60 remains crucial. Volume patterns suggest healthy trading activity, but caution is advised due to potential overbought signals.
Confidence Level
Potential Risks
Market corrections or negative news could impact the stock's performance.
1 Month Prediction
Target: June 2, 2025$4.9
$4.88
$4.95
$4.85
Description
The stock is likely to reach new highs as bullish momentum persists. The MACD and moving averages support this outlook, but the RSI indicates a need for caution as it approaches overbought territory.
Analysis
The stock has shown consistent upward movement, with key resistance at 5.00. The bullish trend is supported by strong volume and positive technical indicators. However, the potential for a pullback exists if the RSI remains in overbought territory.
Confidence Level
Potential Risks
External market factors or economic data releases could lead to volatility.
3 Months Prediction
Target: August 2, 2025$5.2
$5.15
$5.3
$5.1
Description
Long-term bullish sentiment is expected to drive the stock higher, supported by strong fundamentals and market conditions. However, potential corrections may occur as the stock approaches key resistance levels.
Analysis
The stock has maintained a bullish trend over the past three months, with significant support at 5.00. Technical indicators suggest continued upward momentum, but external factors could introduce volatility. Investors should remain cautious of potential corrections.
Confidence Level
Potential Risks
Macroeconomic changes or shifts in market sentiment could impact the stock's trajectory.