HGF Trading Predictions
1 Day Prediction
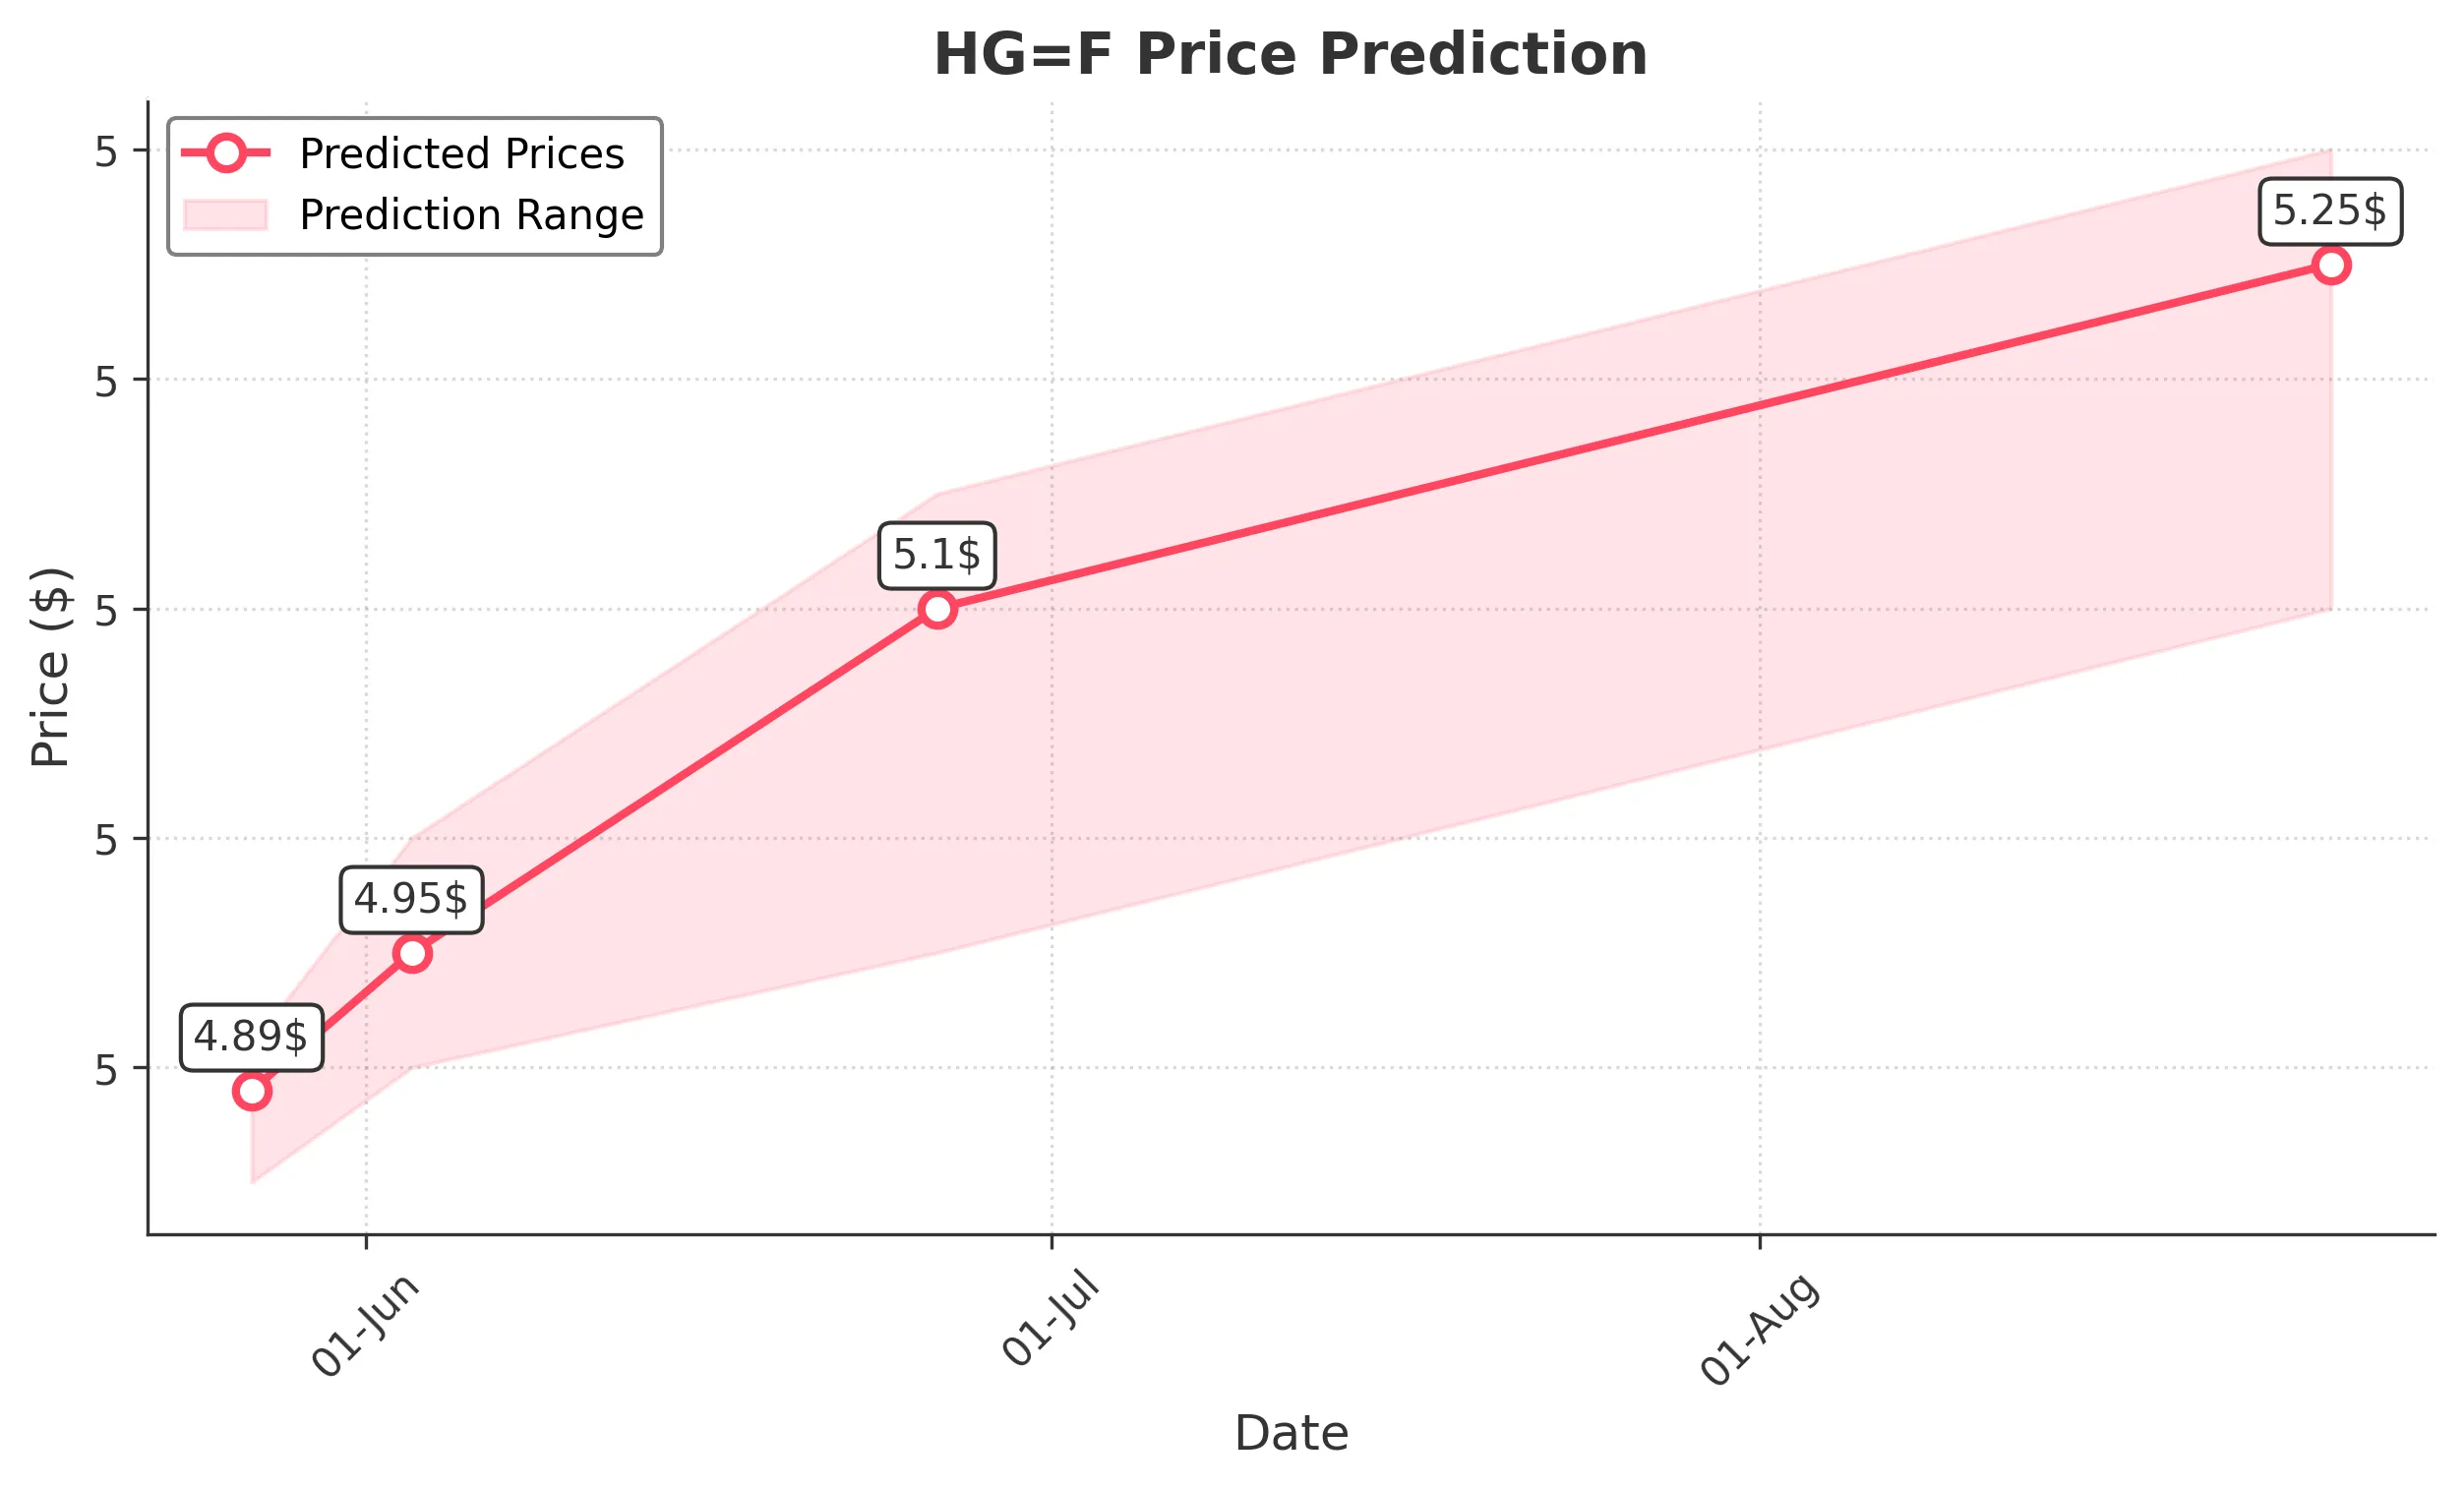
Target: May 27, 2025$4.89
$4.87
$4.91
$4.85
Description
The stock shows a bullish trend with a recent upward movement. The RSI is approaching overbought levels, indicating potential for a pullback. However, the MACD is positive, suggesting continued momentum. Volume has been stable, supporting the price increase.
Analysis
Over the past 3 months, HG=F has shown a bullish trend with significant support around 4.55 and resistance near 4.90. The recent price action indicates a strong upward momentum, but the RSI nearing overbought levels raises concerns about sustainability. Volume patterns have been consistent, with occasional spikes indicating interest.
Confidence Level
Potential Risks
Potential reversal signals from overbought RSI and market volatility could impact the prediction.
1 Week Prediction
Target: June 3, 2025$4.95
$4.91
$5
$4.9
Description
The stock is expected to continue its upward trajectory, supported by bullish sentiment and positive MACD. However, the RSI indicates potential overbought conditions, which may lead to a correction. Volume is expected to remain steady, reflecting ongoing interest.
Analysis
The stock has been in a bullish phase, with key support at 4.85 and resistance at 5.00. The MACD remains positive, but the RSI suggests caution as it approaches overbought territory. Volume trends indicate healthy trading activity, but any significant market news could alter the outlook.
Confidence Level
Potential Risks
Market sentiment shifts or external economic factors could lead to unexpected volatility.
1 Month Prediction
Target: June 26, 2025$5.1
$5
$5.15
$4.95
Description
The stock is projected to maintain its upward trend, driven by strong market sentiment and positive technical indicators. However, the RSI suggests caution as it approaches overbought levels, indicating a possible pullback. Volume is expected to support the upward movement.
Analysis
In the last three months, HG=F has shown a clear bullish trend with significant resistance at 5.10. The MACD is bullish, and the RSI is nearing overbought levels, suggesting a potential correction. Volume patterns have been stable, indicating consistent interest from traders.
Confidence Level
Potential Risks
External economic factors or sudden market shifts could impact the stock's performance.
3 Months Prediction
Target: August 26, 2025$5.25
$5.2
$5.3
$5.1
Description
The stock is expected to continue its upward trend, supported by strong fundamentals and positive market sentiment. However, the RSI indicates potential overbought conditions, which may lead to corrections. Volume is anticipated to remain robust.
Analysis
Over the past three months, HG=F has demonstrated a strong bullish trend with key support at 5.00 and resistance at 5.25. The MACD remains positive, but the RSI nearing overbought levels raises concerns about sustainability. Volume trends indicate healthy trading activity, but external factors could introduce volatility.
Confidence Level
Potential Risks
Market volatility and economic changes could affect the stock's trajectory.