HGF Trading Predictions
1 Day Prediction
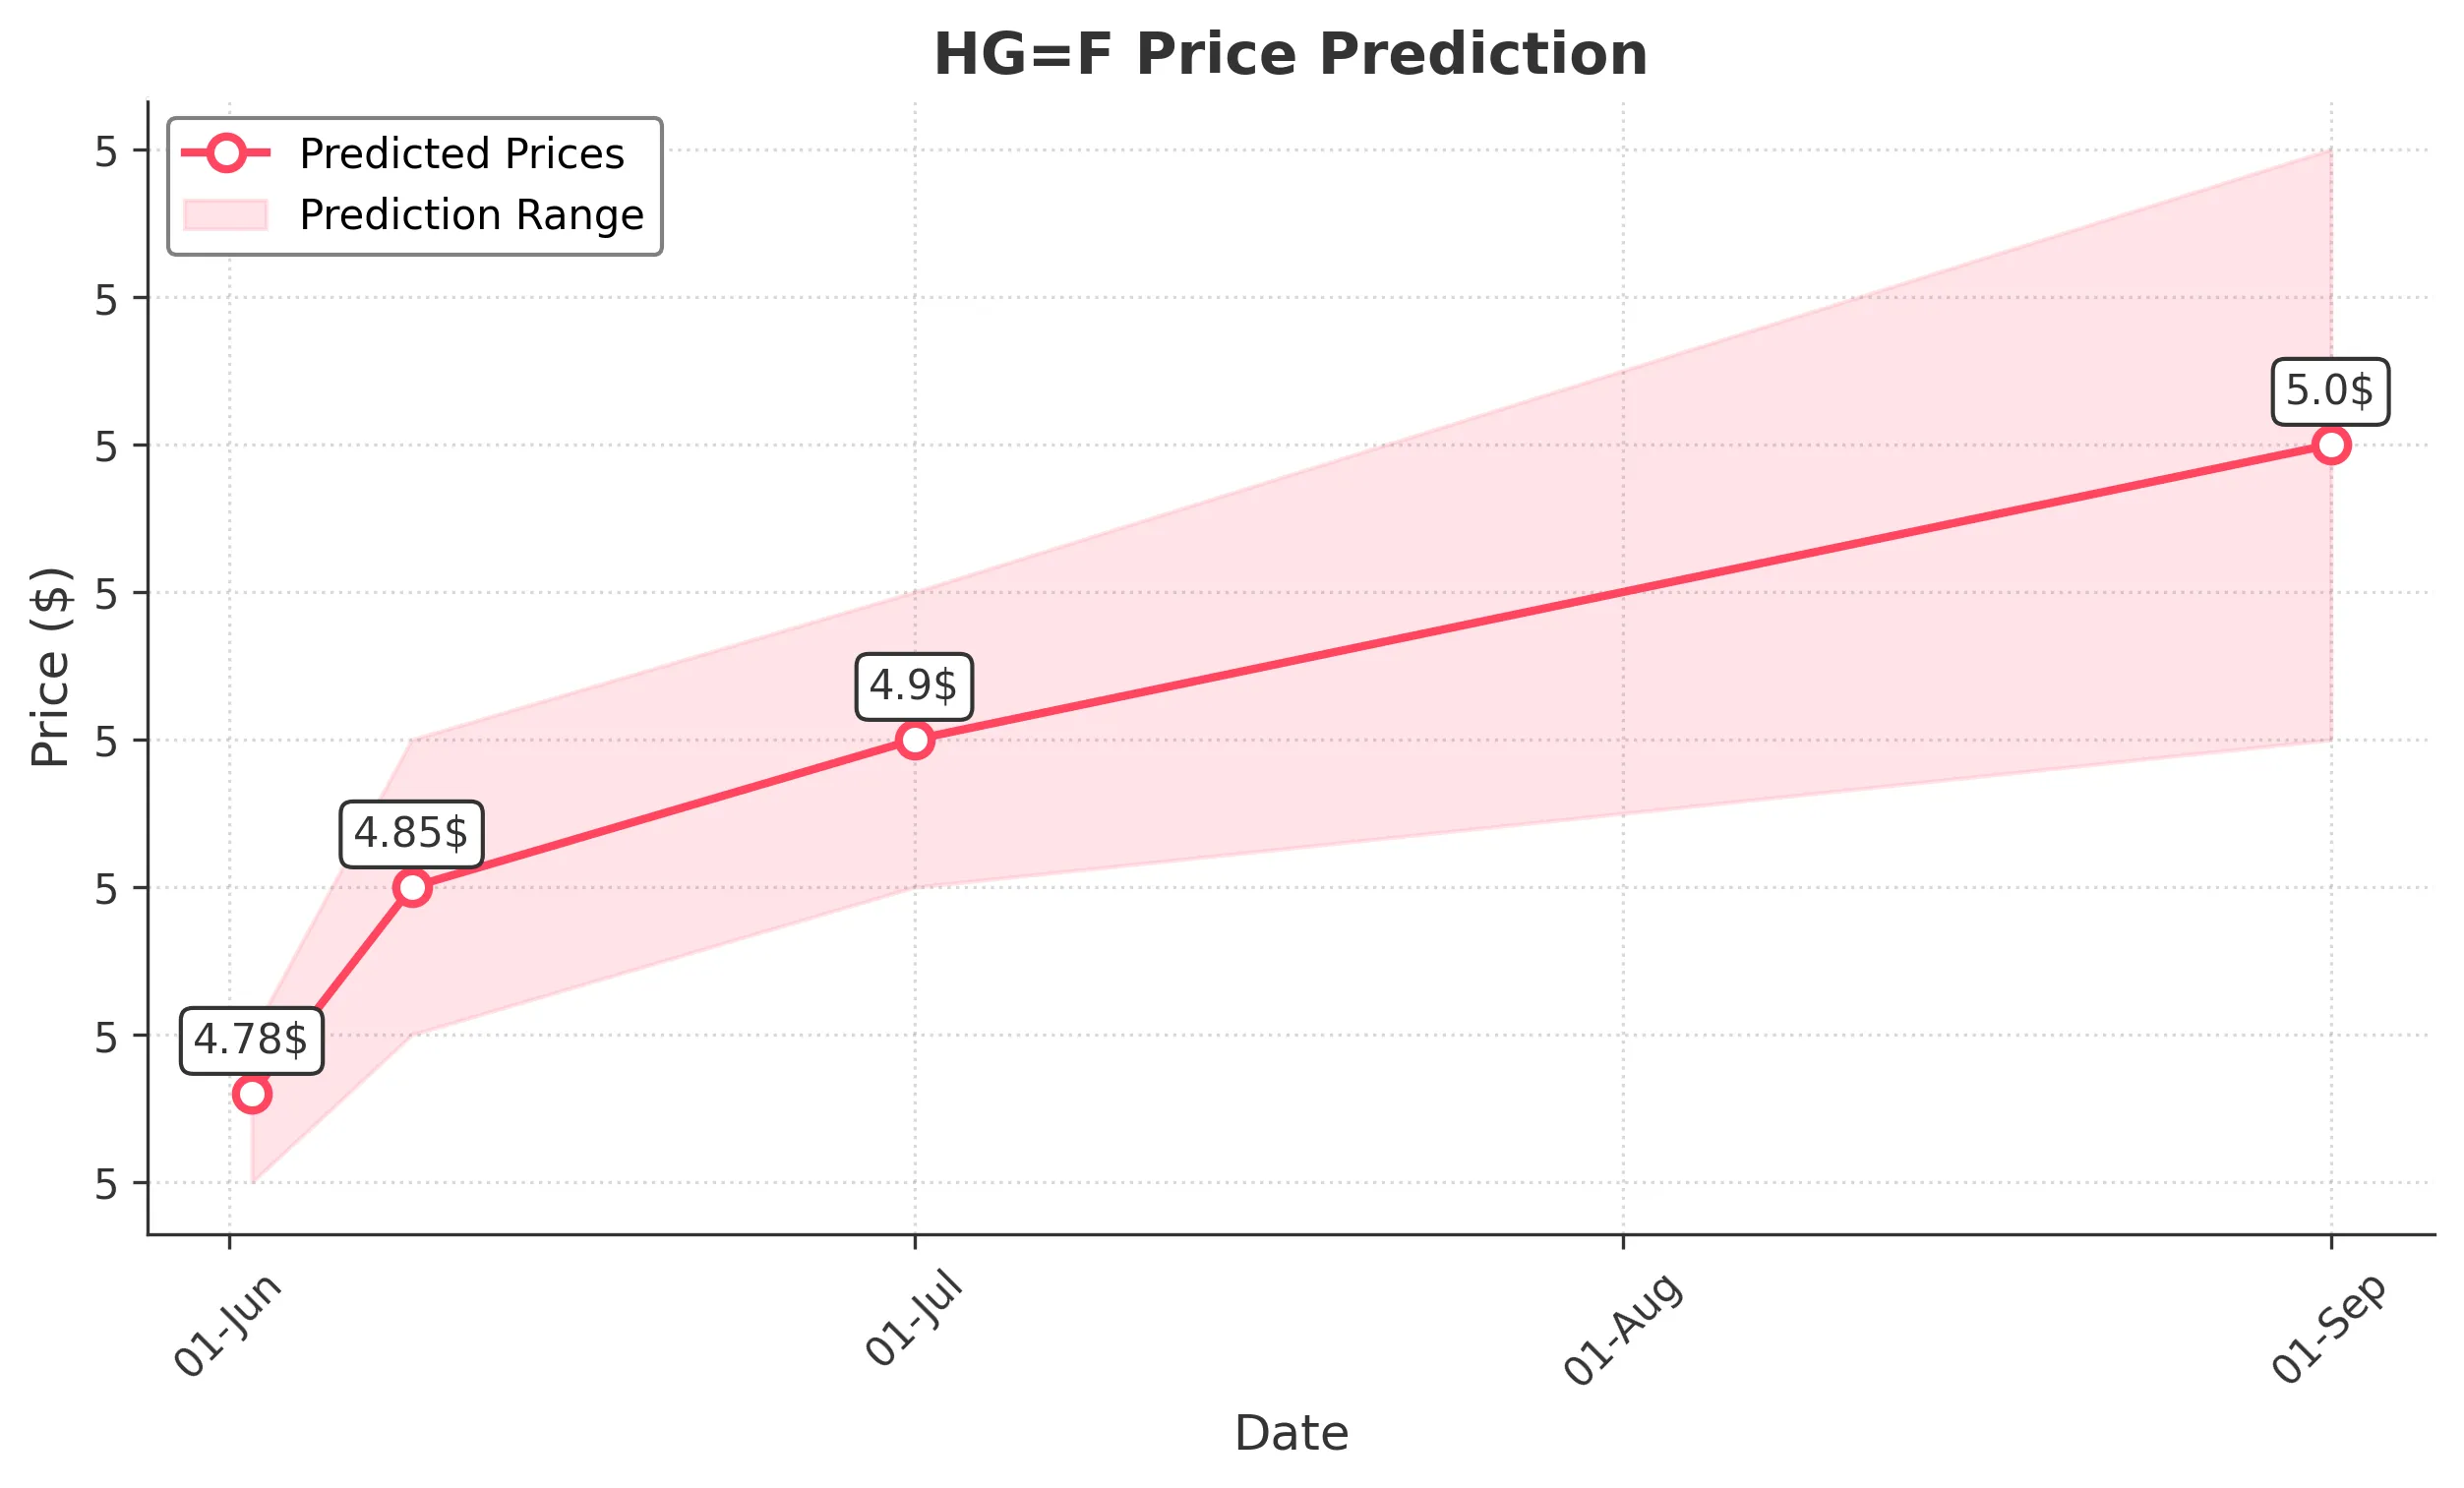
Target: June 2, 2025$4.78
$4.77
$4.8
$4.75
Description
The stock shows a bullish trend with a recent upward movement. The RSI is approaching overbought levels, indicating potential for a pullback. However, the MACD remains positive, suggesting continued upward momentum. Volume is stable, supporting the price action.
Analysis
Over the past 3 months, HG=F has shown a bullish trend with significant support around 4.55 and resistance near 4.80. The recent price action indicates a recovery from a dip, with the MACD and moving averages supporting upward momentum. However, the RSI indicates overbought conditions, suggesting caution.
Confidence Level
Potential Risks
Potential market volatility and external news could impact the prediction.
1 Week Prediction
Target: June 9, 2025$4.85
$4.83
$4.9
$4.8
Description
The stock is expected to continue its upward trend, supported by recent bullish candlestick patterns. The MACD remains positive, and the price is above the 50-day moving average. However, the RSI indicates potential overbought conditions, which could lead to a pullback.
Analysis
The stock has been in a bullish phase, with key support at 4.70 and resistance at 4.90. The recent price action shows a series of higher highs and higher lows, indicating strong buying interest. However, the RSI nearing overbought levels suggests a possible correction.
Confidence Level
Potential Risks
Market sentiment and external economic factors could lead to unexpected volatility.
1 Month Prediction
Target: July 1, 2025$4.9
$4.87
$4.95
$4.85
Description
The stock is likely to maintain its upward trajectory, with bullish momentum supported by positive technical indicators. The MACD remains above the signal line, and the price is expected to test the resistance level at 4.90. Watch for potential pullbacks.
Analysis
In the last three months, HG=F has shown a strong bullish trend, with significant support at 4.70 and resistance at 4.90. The stock's performance has been characterized by increasing volume and positive momentum indicators, although the RSI suggests caution due to overbought conditions.
Confidence Level
Potential Risks
Economic data releases and geopolitical events could impact market sentiment.
3 Months Prediction
Target: September 1, 2025$5
$4.95
$5.1
$4.9
Description
The stock is expected to reach new highs, driven by strong demand and positive market sentiment. The MACD and moving averages indicate a sustained bullish trend. However, watch for potential corrections as the RSI approaches overbought territory.
Analysis
Over the past three months, HG=F has demonstrated a clear bullish trend, with key support at 4.70 and resistance at 5.00. The stock has shown resilience despite recent volatility, and technical indicators suggest continued upward momentum, although external factors could introduce risks.
Confidence Level
Potential Risks
Long-term predictions are subject to greater uncertainty due to market fluctuations and economic changes.