HGF Trading Predictions
1 Day Prediction
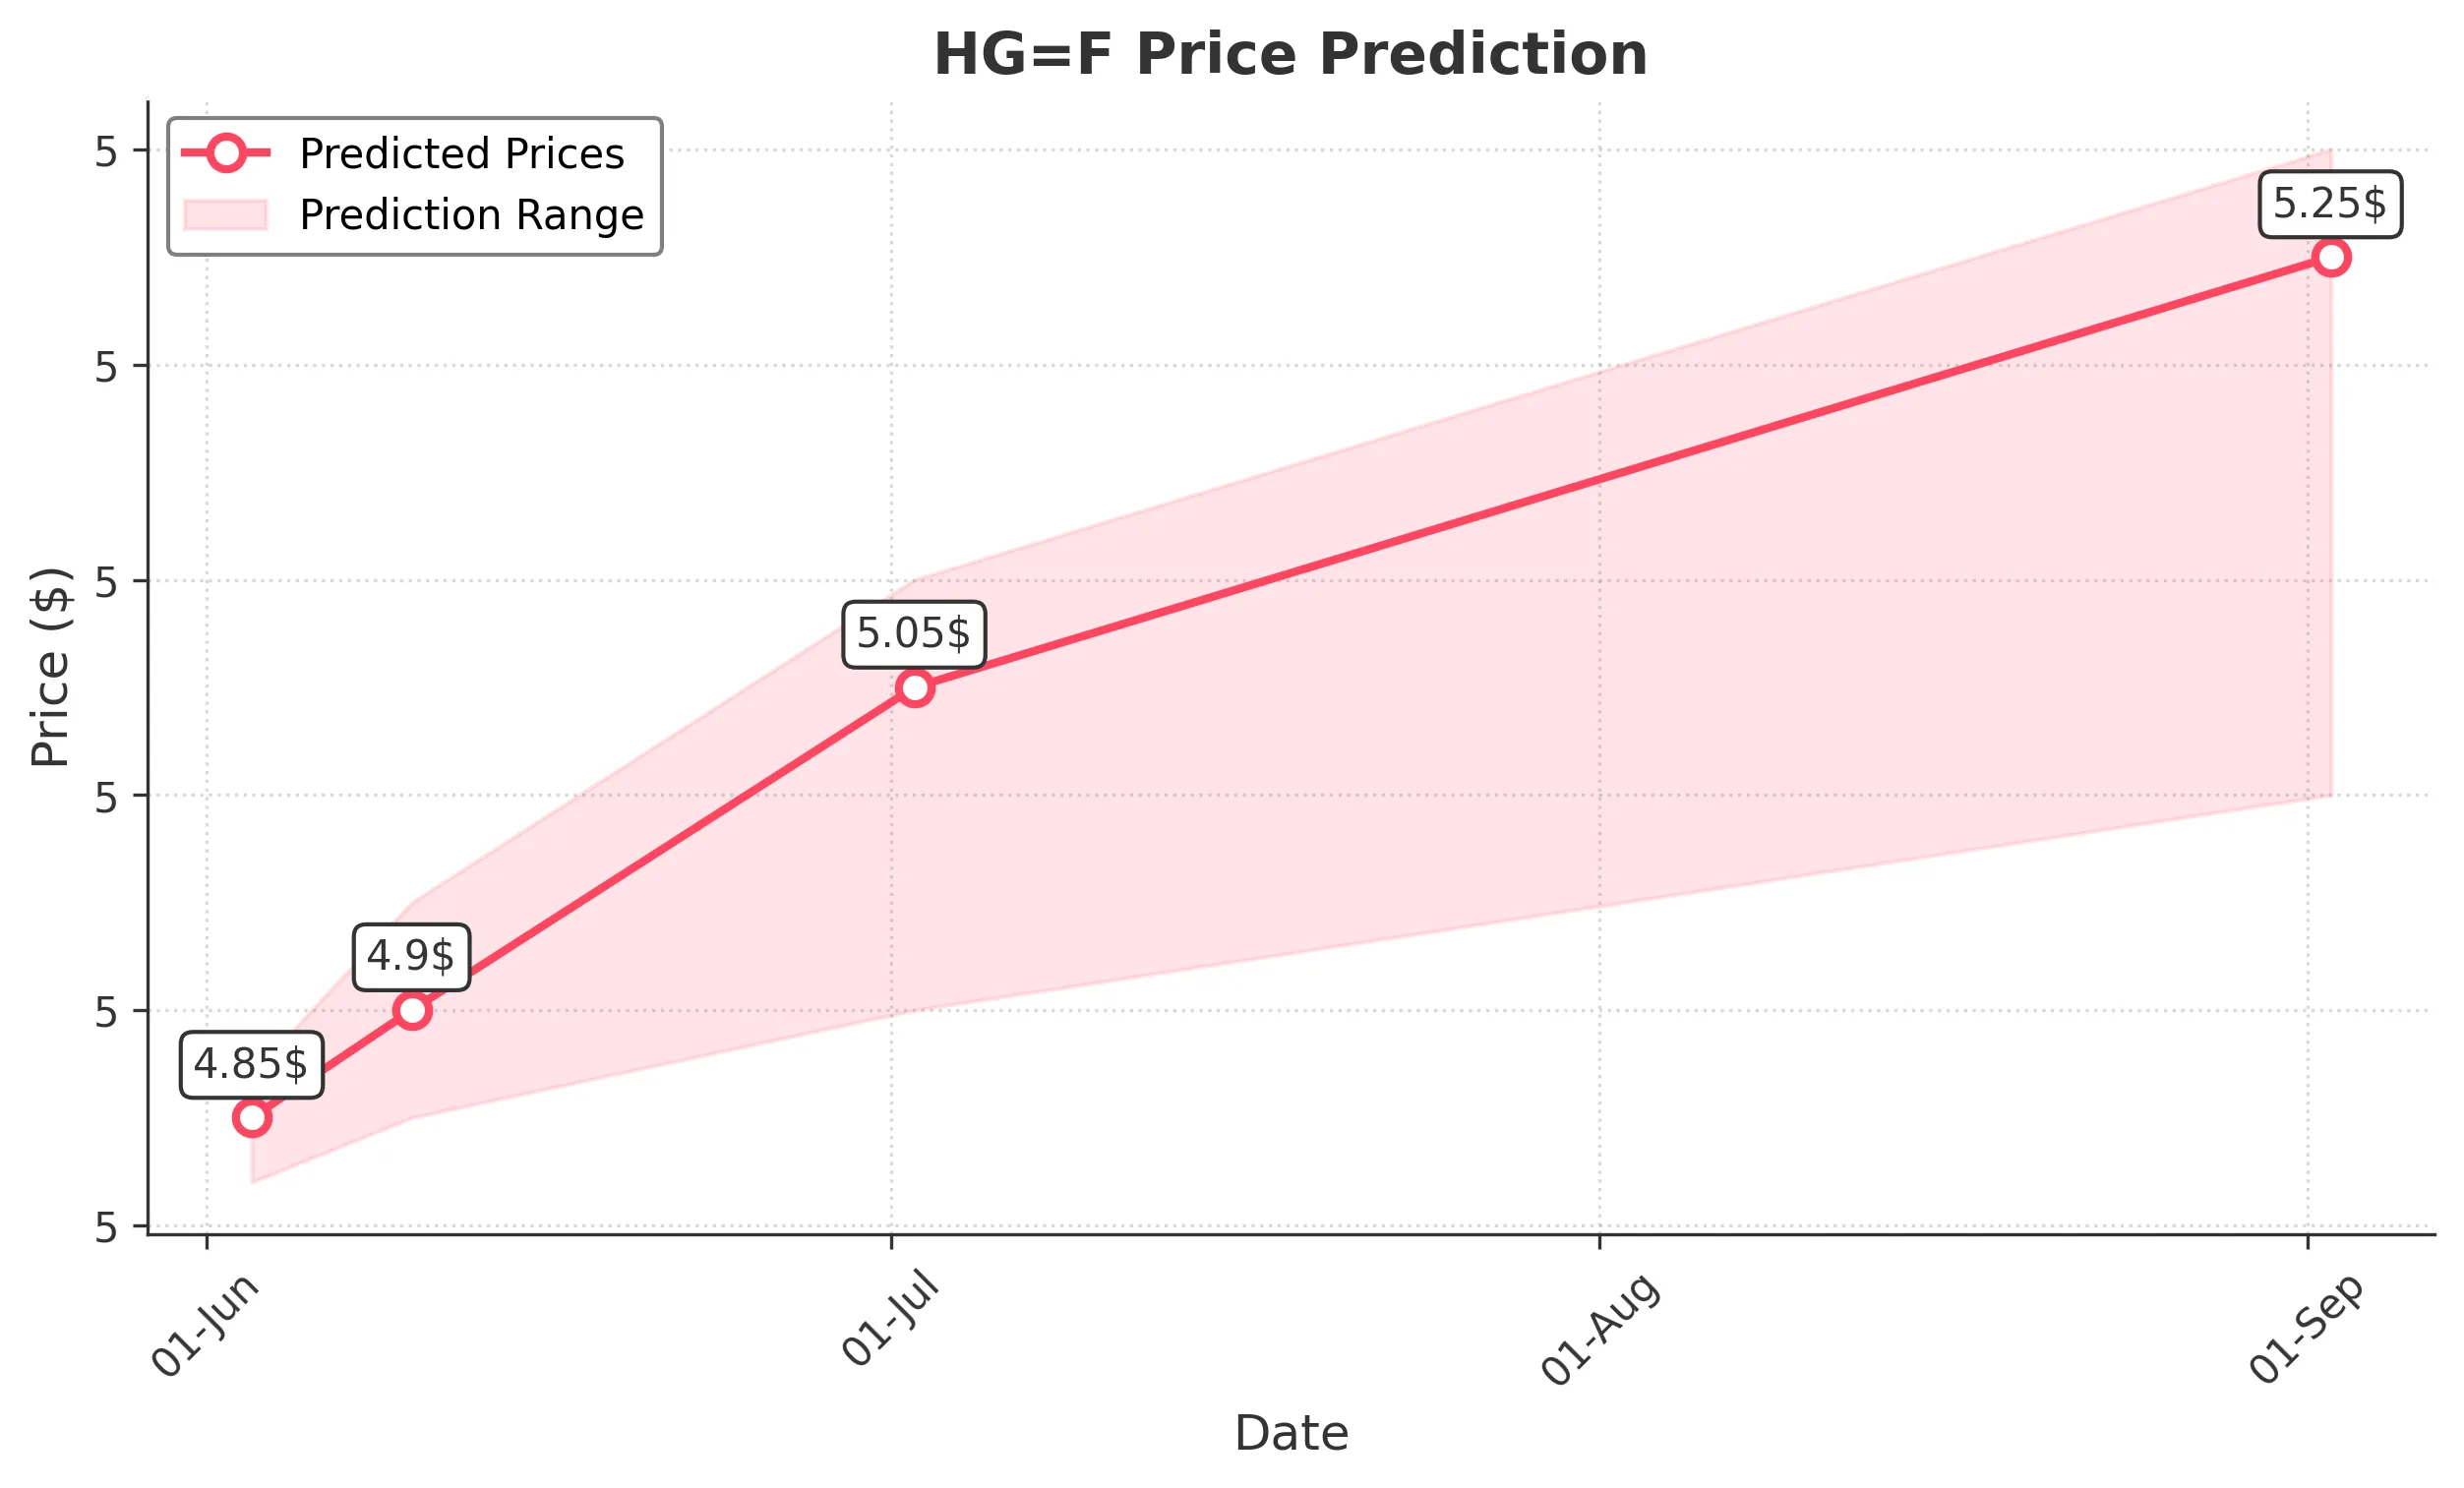
Target: June 3, 2025$4.85
$4.84
$4.87
$4.82
Description
The stock shows a bullish trend with a recent close above the 50-day moving average. RSI indicates overbought conditions, suggesting a potential pullback. However, the MACD remains positive, supporting upward momentum.
Analysis
Over the past 3 months, HG=F has shown a bullish trend with significant support at 4.60 and resistance around 5.00. Recent volume spikes indicate strong buying interest, but RSI suggests caution due to overbought conditions.
Confidence Level
Potential Risks
Potential market volatility and profit-taking could lead to a price drop.
1 Week Prediction
Target: June 10, 2025$4.9
$4.87
$4.95
$4.85
Description
The stock is expected to continue its upward trajectory, supported by bullish candlestick patterns and a positive MACD. However, the RSI indicates potential overbought conditions, which could lead to a correction.
Analysis
The stock has been in a bullish phase, with key support at 4.80 and resistance at 5.00. The recent price action shows strong buying volume, but the overbought RSI raises concerns about sustainability.
Confidence Level
Potential Risks
Market sentiment could shift due to external economic factors, impacting the stock's performance.
1 Month Prediction
Target: July 2, 2025$5.05
$4.95
$5.1
$4.9
Description
The stock is likely to break through the resistance at 5.00, driven by positive market sentiment and strong fundamentals. However, the RSI suggests caution as it approaches overbought territory.
Analysis
The stock has shown consistent upward movement, with strong support at 4.80. The MACD indicates bullish momentum, while volume trends suggest increasing investor interest. However, external factors could pose risks.
Confidence Level
Potential Risks
Any negative macroeconomic news could reverse the bullish trend.
3 Months Prediction
Target: September 2, 2025$5.25
$5.1
$5.3
$5
Description
The stock is expected to maintain its upward trend, supported by strong fundamentals and positive market sentiment. However, potential resistance at 5.30 may lead to short-term corrections.
Analysis
Over the past 3 months, HG=F has shown a strong bullish trend with key support at 4.80 and resistance at 5.30. The MACD and volume trends indicate strong buying interest, but external economic factors could introduce volatility.
Confidence Level
Potential Risks
Market volatility and economic uncertainties could impact the stock's performance.