HGF Trading Predictions
1 Day Prediction
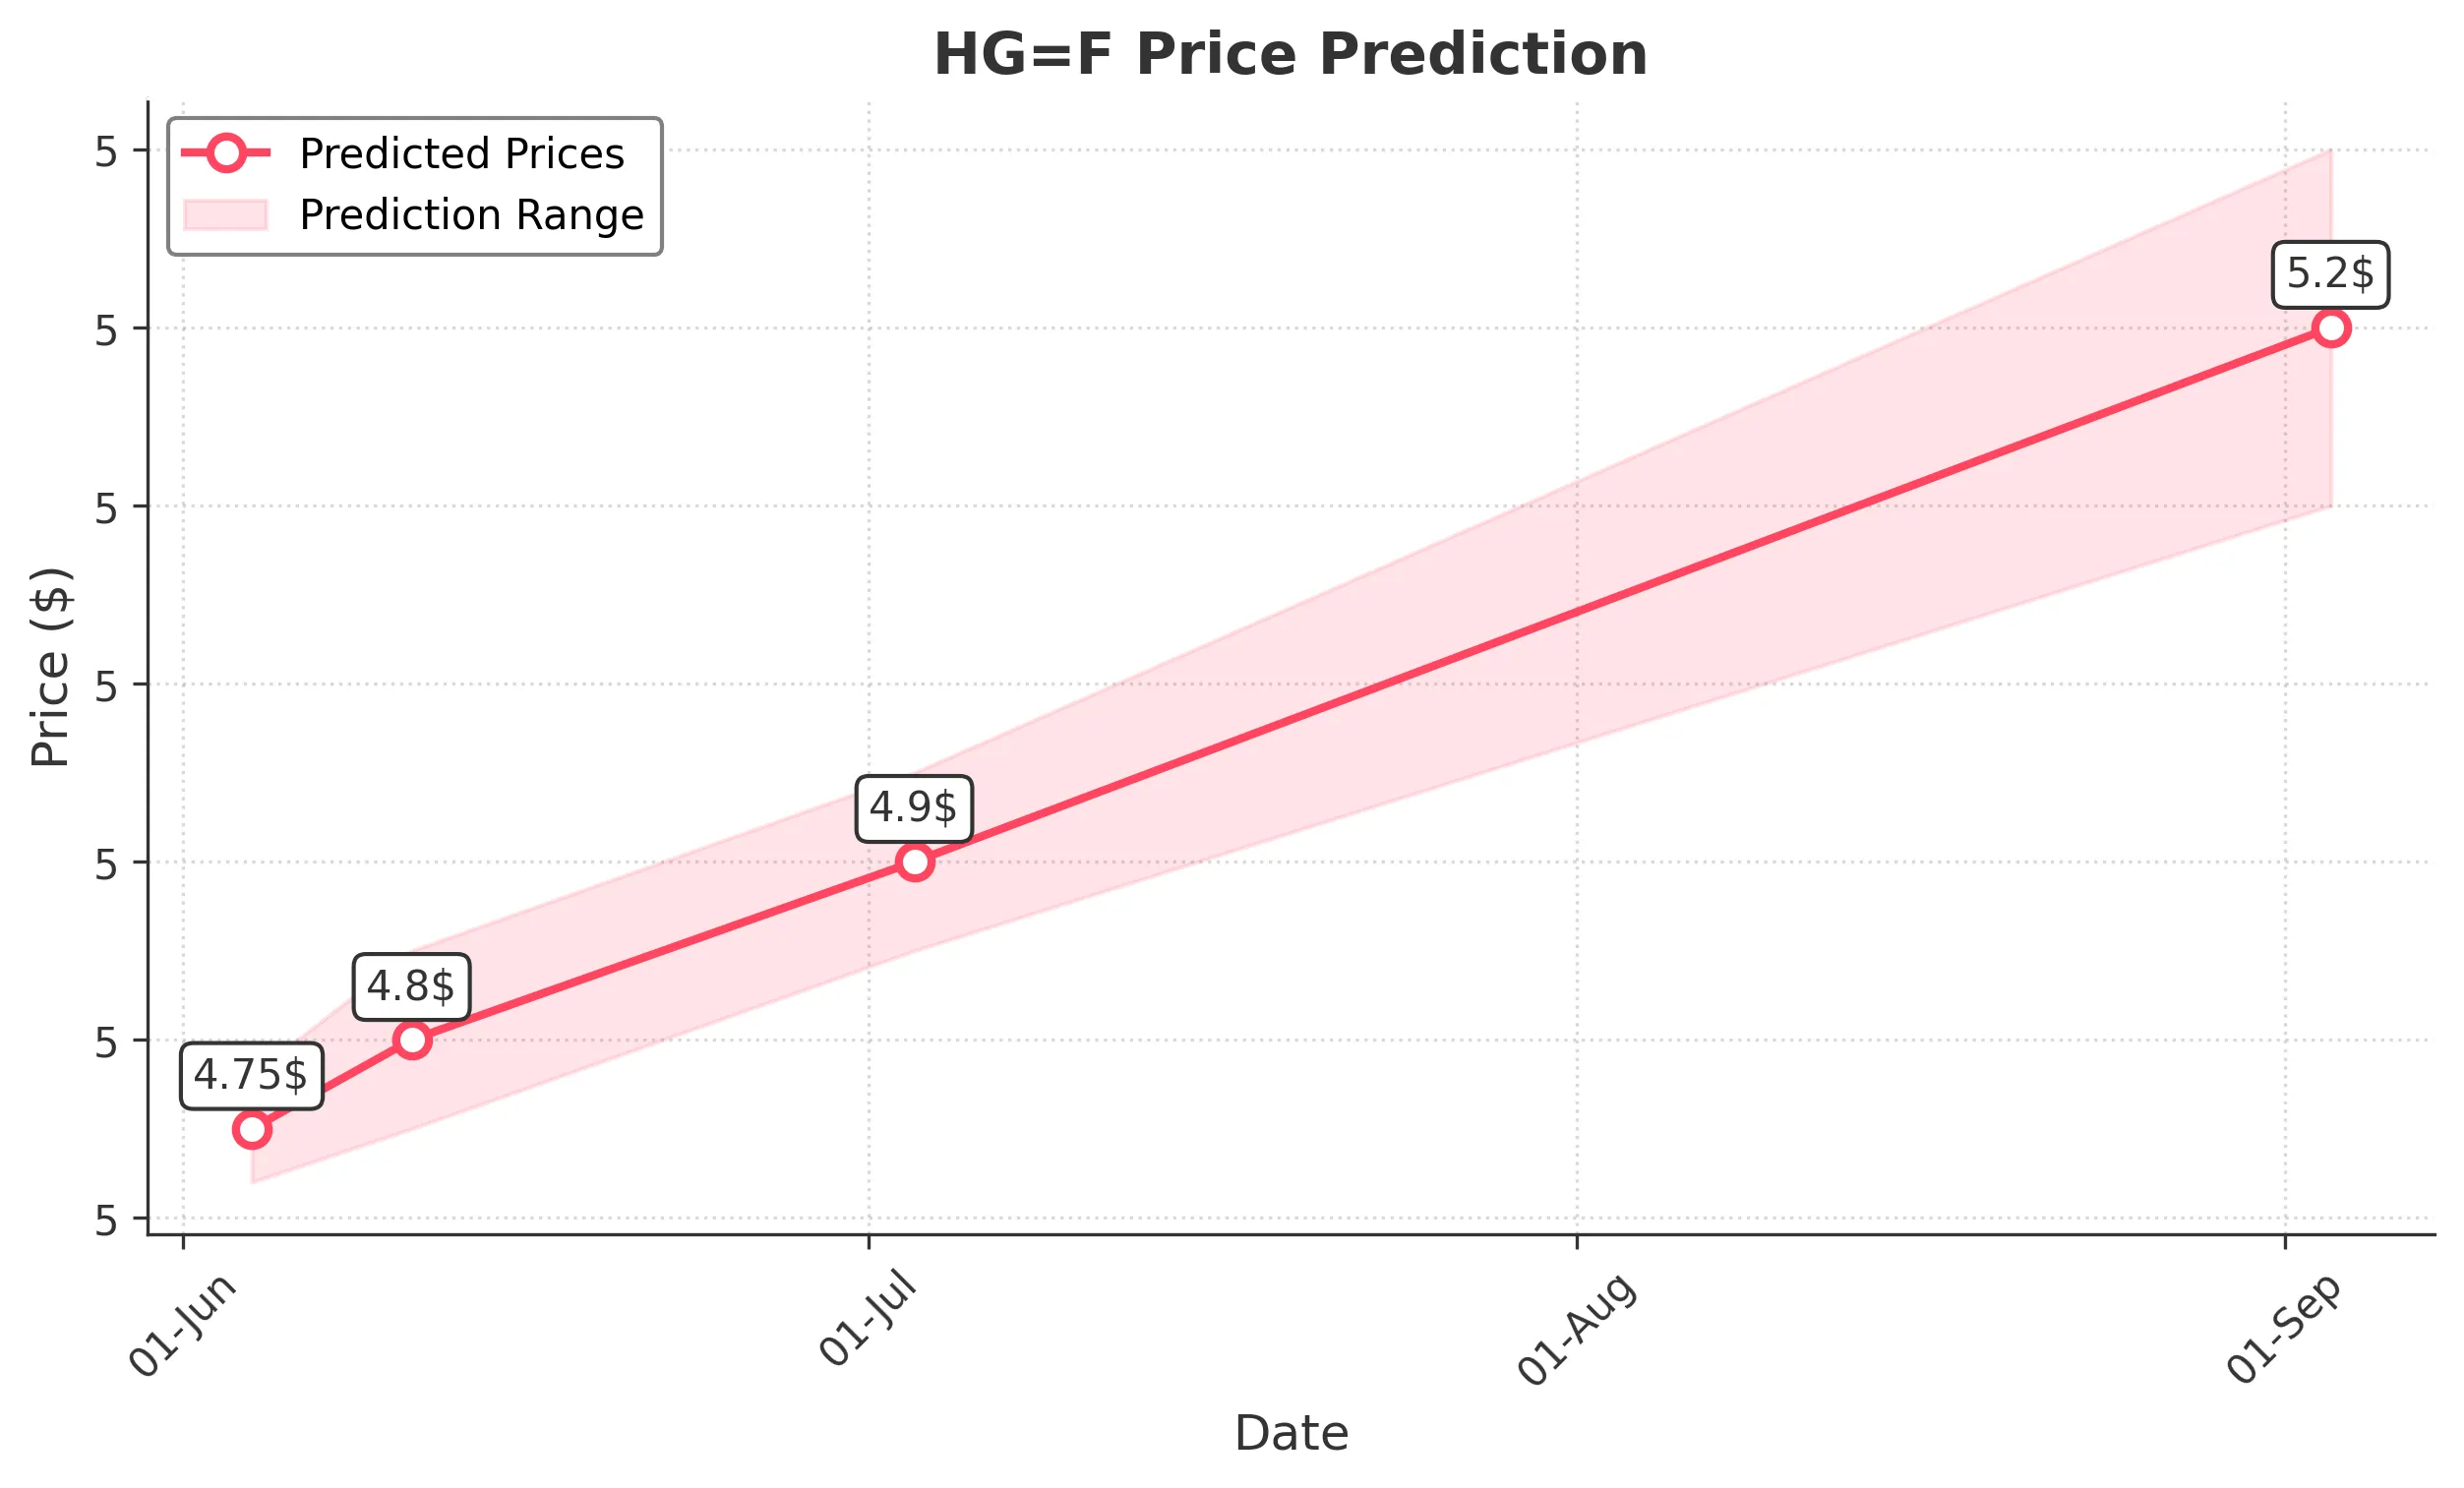
Target: June 4, 2025$4.75
$4.74
$4.78
$4.72
Description
The stock shows a slight bullish trend with a recent close of 4.7400. The RSI is neutral, and MACD indicates potential upward momentum. However, volatility remains, suggesting caution.
Analysis
Over the past 3 months, HG=F has shown a bullish trend with significant support around 4.60. Recent volume spikes indicate increased interest, but the stock has faced resistance near 4.80. Technical indicators suggest a cautious bullish outlook.
Confidence Level
Potential Risks
Market sentiment could shift due to external factors, and a reversal is possible if selling pressure increases.
1 Week Prediction
Target: June 11, 2025$4.8
$4.75
$4.85
$4.75
Description
The stock is expected to continue its upward trajectory, supported by recent bullish candlestick patterns. The MACD is positive, and the RSI is approaching overbought territory, indicating potential upward movement.
Analysis
The stock has been in a bullish phase, with key support at 4.60 and resistance at 4.80. The recent increase in volume suggests strong buying interest, but caution is warranted as the stock approaches overbought conditions.
Confidence Level
Potential Risks
Potential market corrections or negative news could impact the stock's performance, leading to volatility.
1 Month Prediction
Target: July 3, 2025$4.9
$4.8
$4.95
$4.85
Description
The stock is likely to reach 4.9000 as bullish momentum continues. The MACD remains positive, and the stock is testing Fibonacci retracement levels, indicating potential for further gains.
Analysis
The stock has shown a consistent upward trend, with significant support at 4.60. The recent bullish patterns and positive volume trends suggest continued upward momentum, but external factors could introduce risk.
Confidence Level
Potential Risks
Market volatility and external economic factors could lead to unexpected price movements.
3 Months Prediction
Target: September 3, 2025$5.2
$5.1
$5.3
$5.1
Description
Long-term outlook remains bullish with potential to reach 5.2000. The stock is expected to break through resistance levels, supported by positive market sentiment and technical indicators.
Analysis
The stock has been on a bullish trend, with key resistance at 5.00. The positive MACD and RSI suggest continued upward movement, but potential market corrections and external economic factors could pose risks.
Confidence Level
Potential Risks
Economic conditions and market sentiment shifts could impact the stock's ability to maintain upward momentum.