HGF Trading Predictions
1 Day Prediction
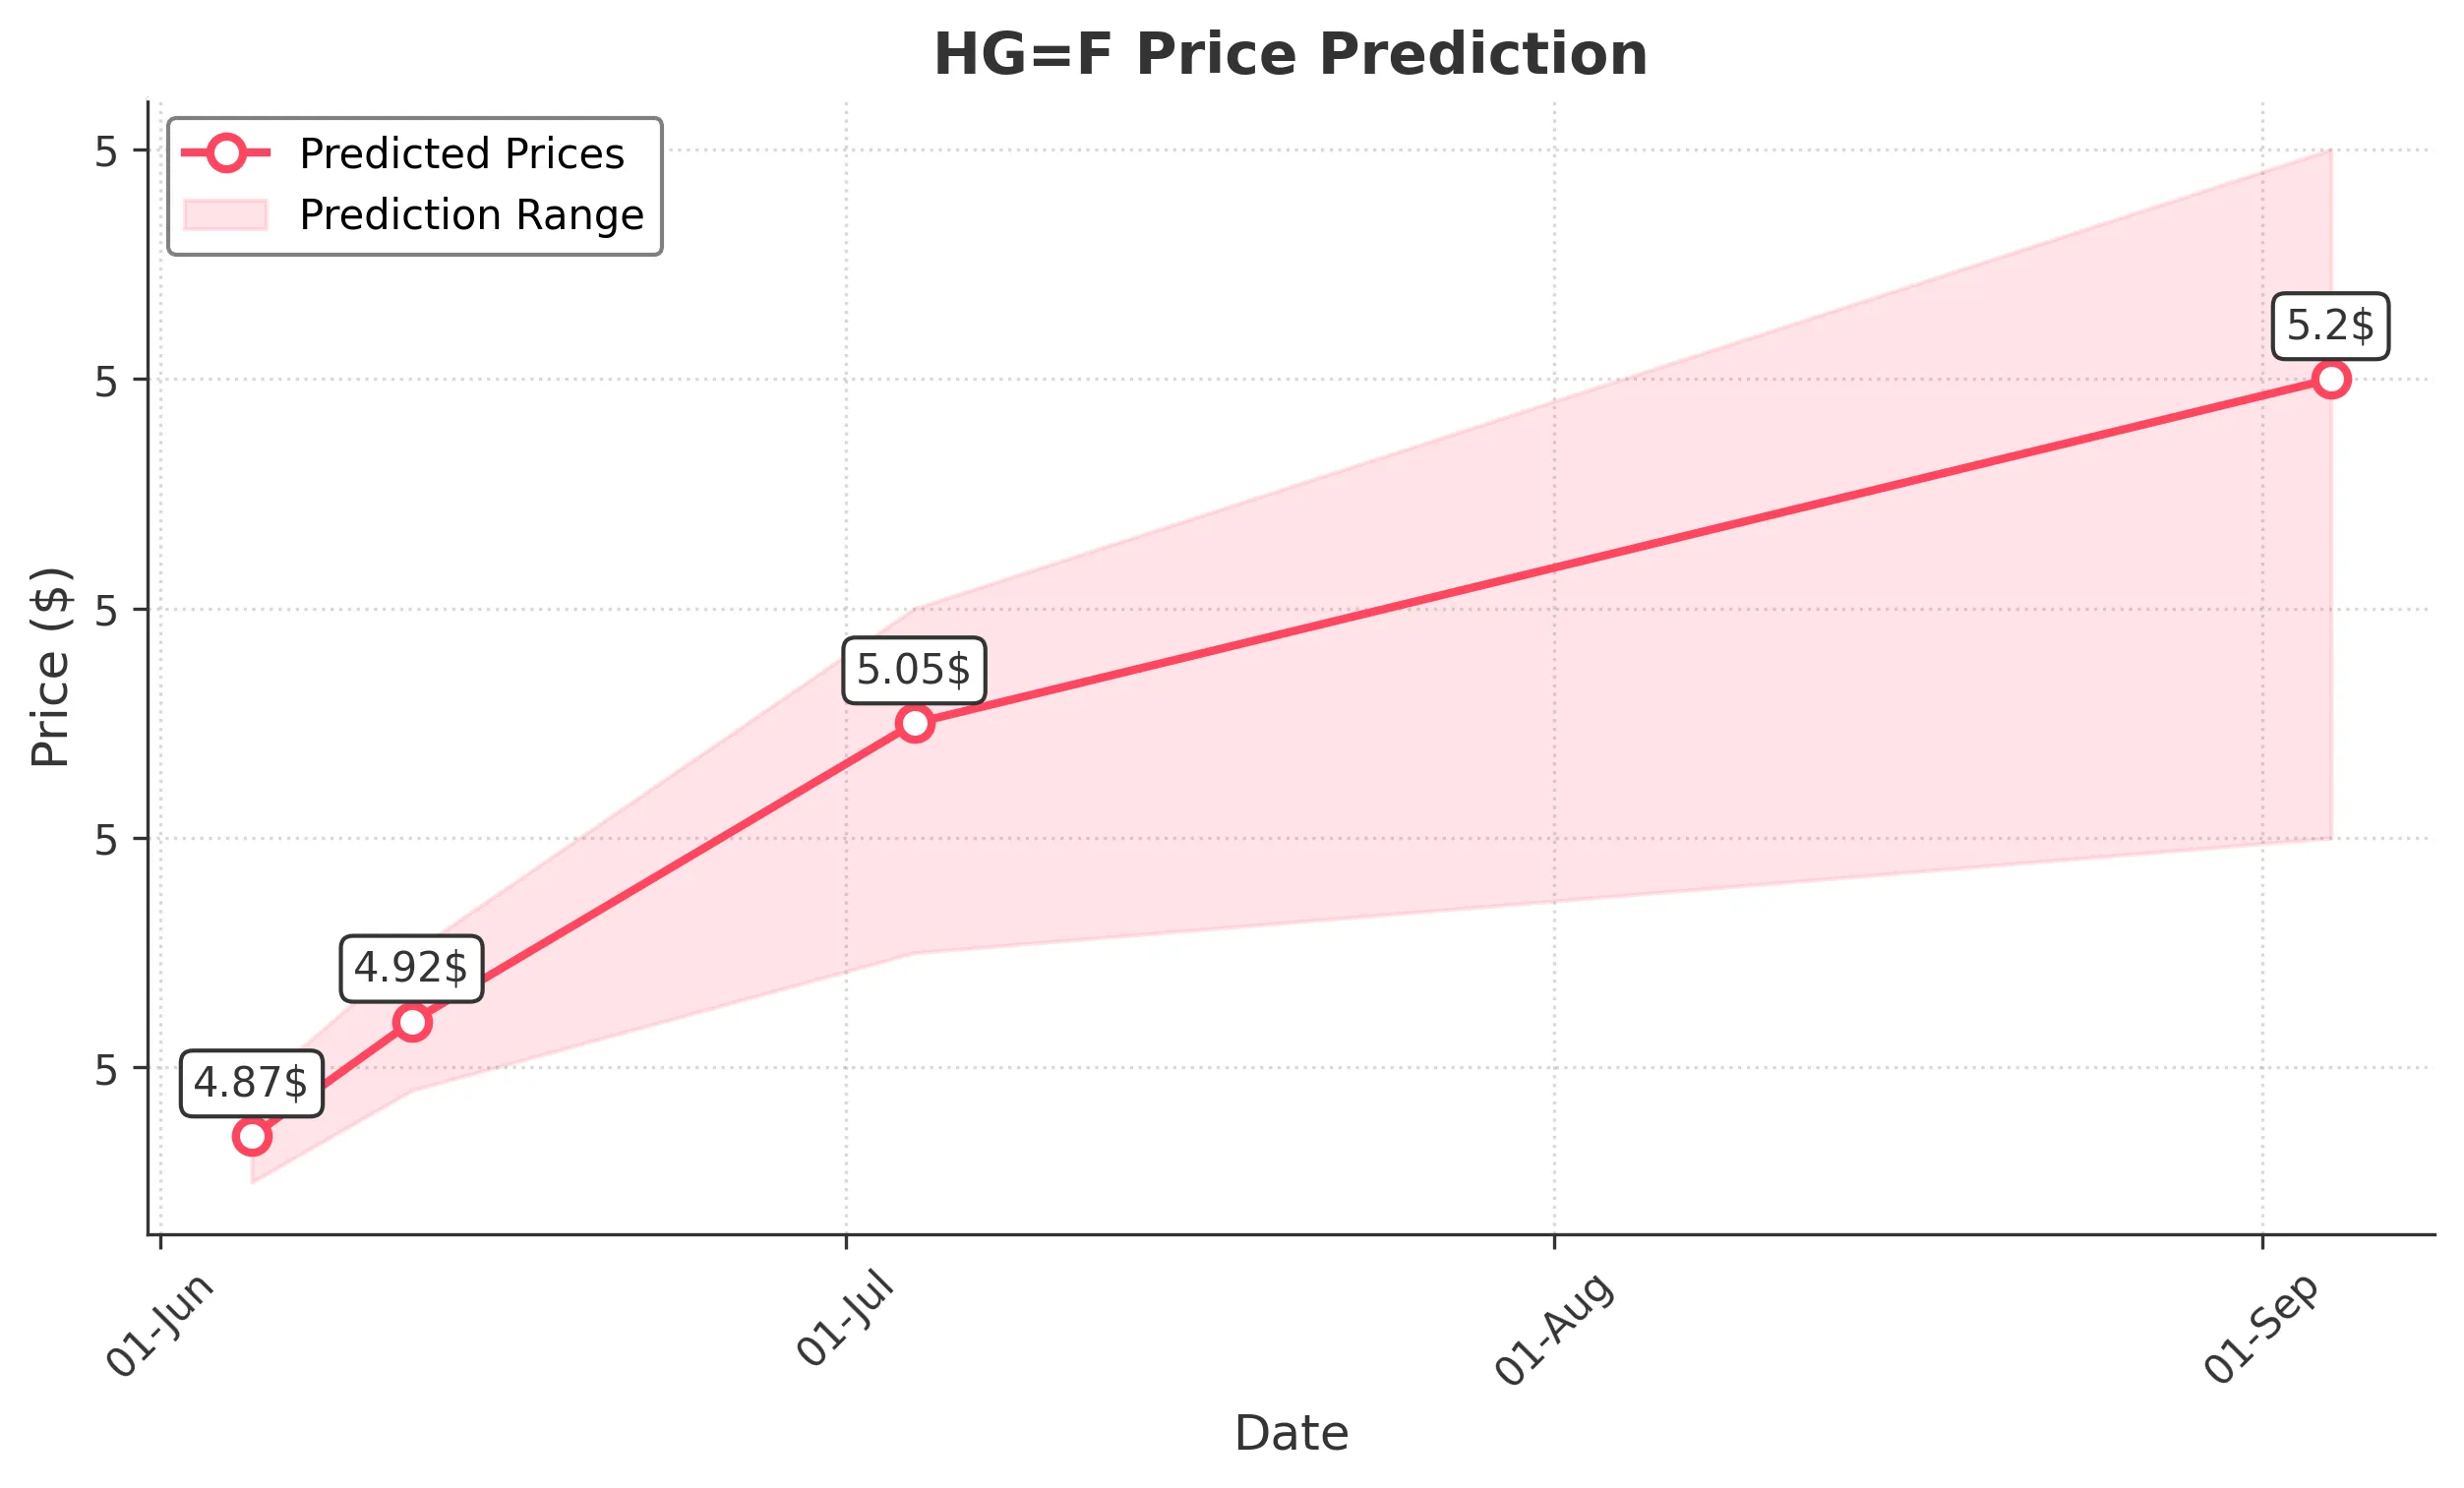
Target: June 5, 2025$4.87
$4.86
$4.89
$4.85
Description
The stock shows a bullish trend with a recent upward movement. The RSI is approaching overbought levels, indicating potential for a pullback. However, the MACD is positive, suggesting continued momentum. Expect slight fluctuations around the predicted close.
Analysis
Over the past 3 months, HG=F has shown a bullish trend with significant support at 4.60 and resistance around 5.00. The recent price action indicates a strong upward momentum, but the RSI nearing overbought levels suggests caution. Volume has been stable, with occasional spikes indicating interest.
Confidence Level
Potential Risks
Potential market volatility and profit-taking could lead to unexpected price movements.
1 Week Prediction
Target: June 12, 2025$4.92
$4.9
$4.95
$4.89
Description
The stock is expected to continue its upward trajectory, supported by positive MACD and bullish candlestick patterns. However, the RSI indicates potential overbought conditions, which may lead to a correction. Watch for volume trends to confirm strength.
Analysis
The stock has maintained a bullish trend with key support at 4.80 and resistance at 5.00. Technical indicators suggest continued upward momentum, but caution is warranted as the RSI approaches overbought territory. Volume patterns indicate healthy trading activity.
Confidence Level
Potential Risks
Market sentiment could shift due to external economic factors, impacting the stock's performance.
1 Month Prediction
Target: July 4, 2025$5.05
$5
$5.1
$4.95
Description
The stock is likely to reach new highs as bullish momentum persists. The MACD remains positive, and the price is above the 50-day moving average. However, the RSI indicates potential overbought conditions, suggesting a possible pullback.
Analysis
In the last three months, HG=F has shown a strong bullish trend, with significant resistance at 5.00. The stock's performance has been supported by positive technical indicators, but the risk of a correction exists as the RSI approaches overbought levels. Volume trends remain stable.
Confidence Level
Potential Risks
Economic data releases and geopolitical events could introduce volatility, affecting the stock's trajectory.
3 Months Prediction
Target: September 4, 2025$5.2
$5.15
$5.3
$5
Description
The stock is expected to continue its upward trend, driven by strong market sentiment and positive technical indicators. However, potential resistance at 5.25 may lead to short-term corrections. Monitor volume for signs of trend strength.
Analysis
The stock has shown a consistent bullish trend over the past three months, with key support at 4.80 and resistance at 5.25. Technical indicators suggest continued upward momentum, but external factors could introduce volatility. The market sentiment remains cautiously optimistic.
Confidence Level
Potential Risks
Long-term predictions are subject to market fluctuations and economic changes that could impact investor sentiment.