HGF Trading Predictions
1 Day Prediction
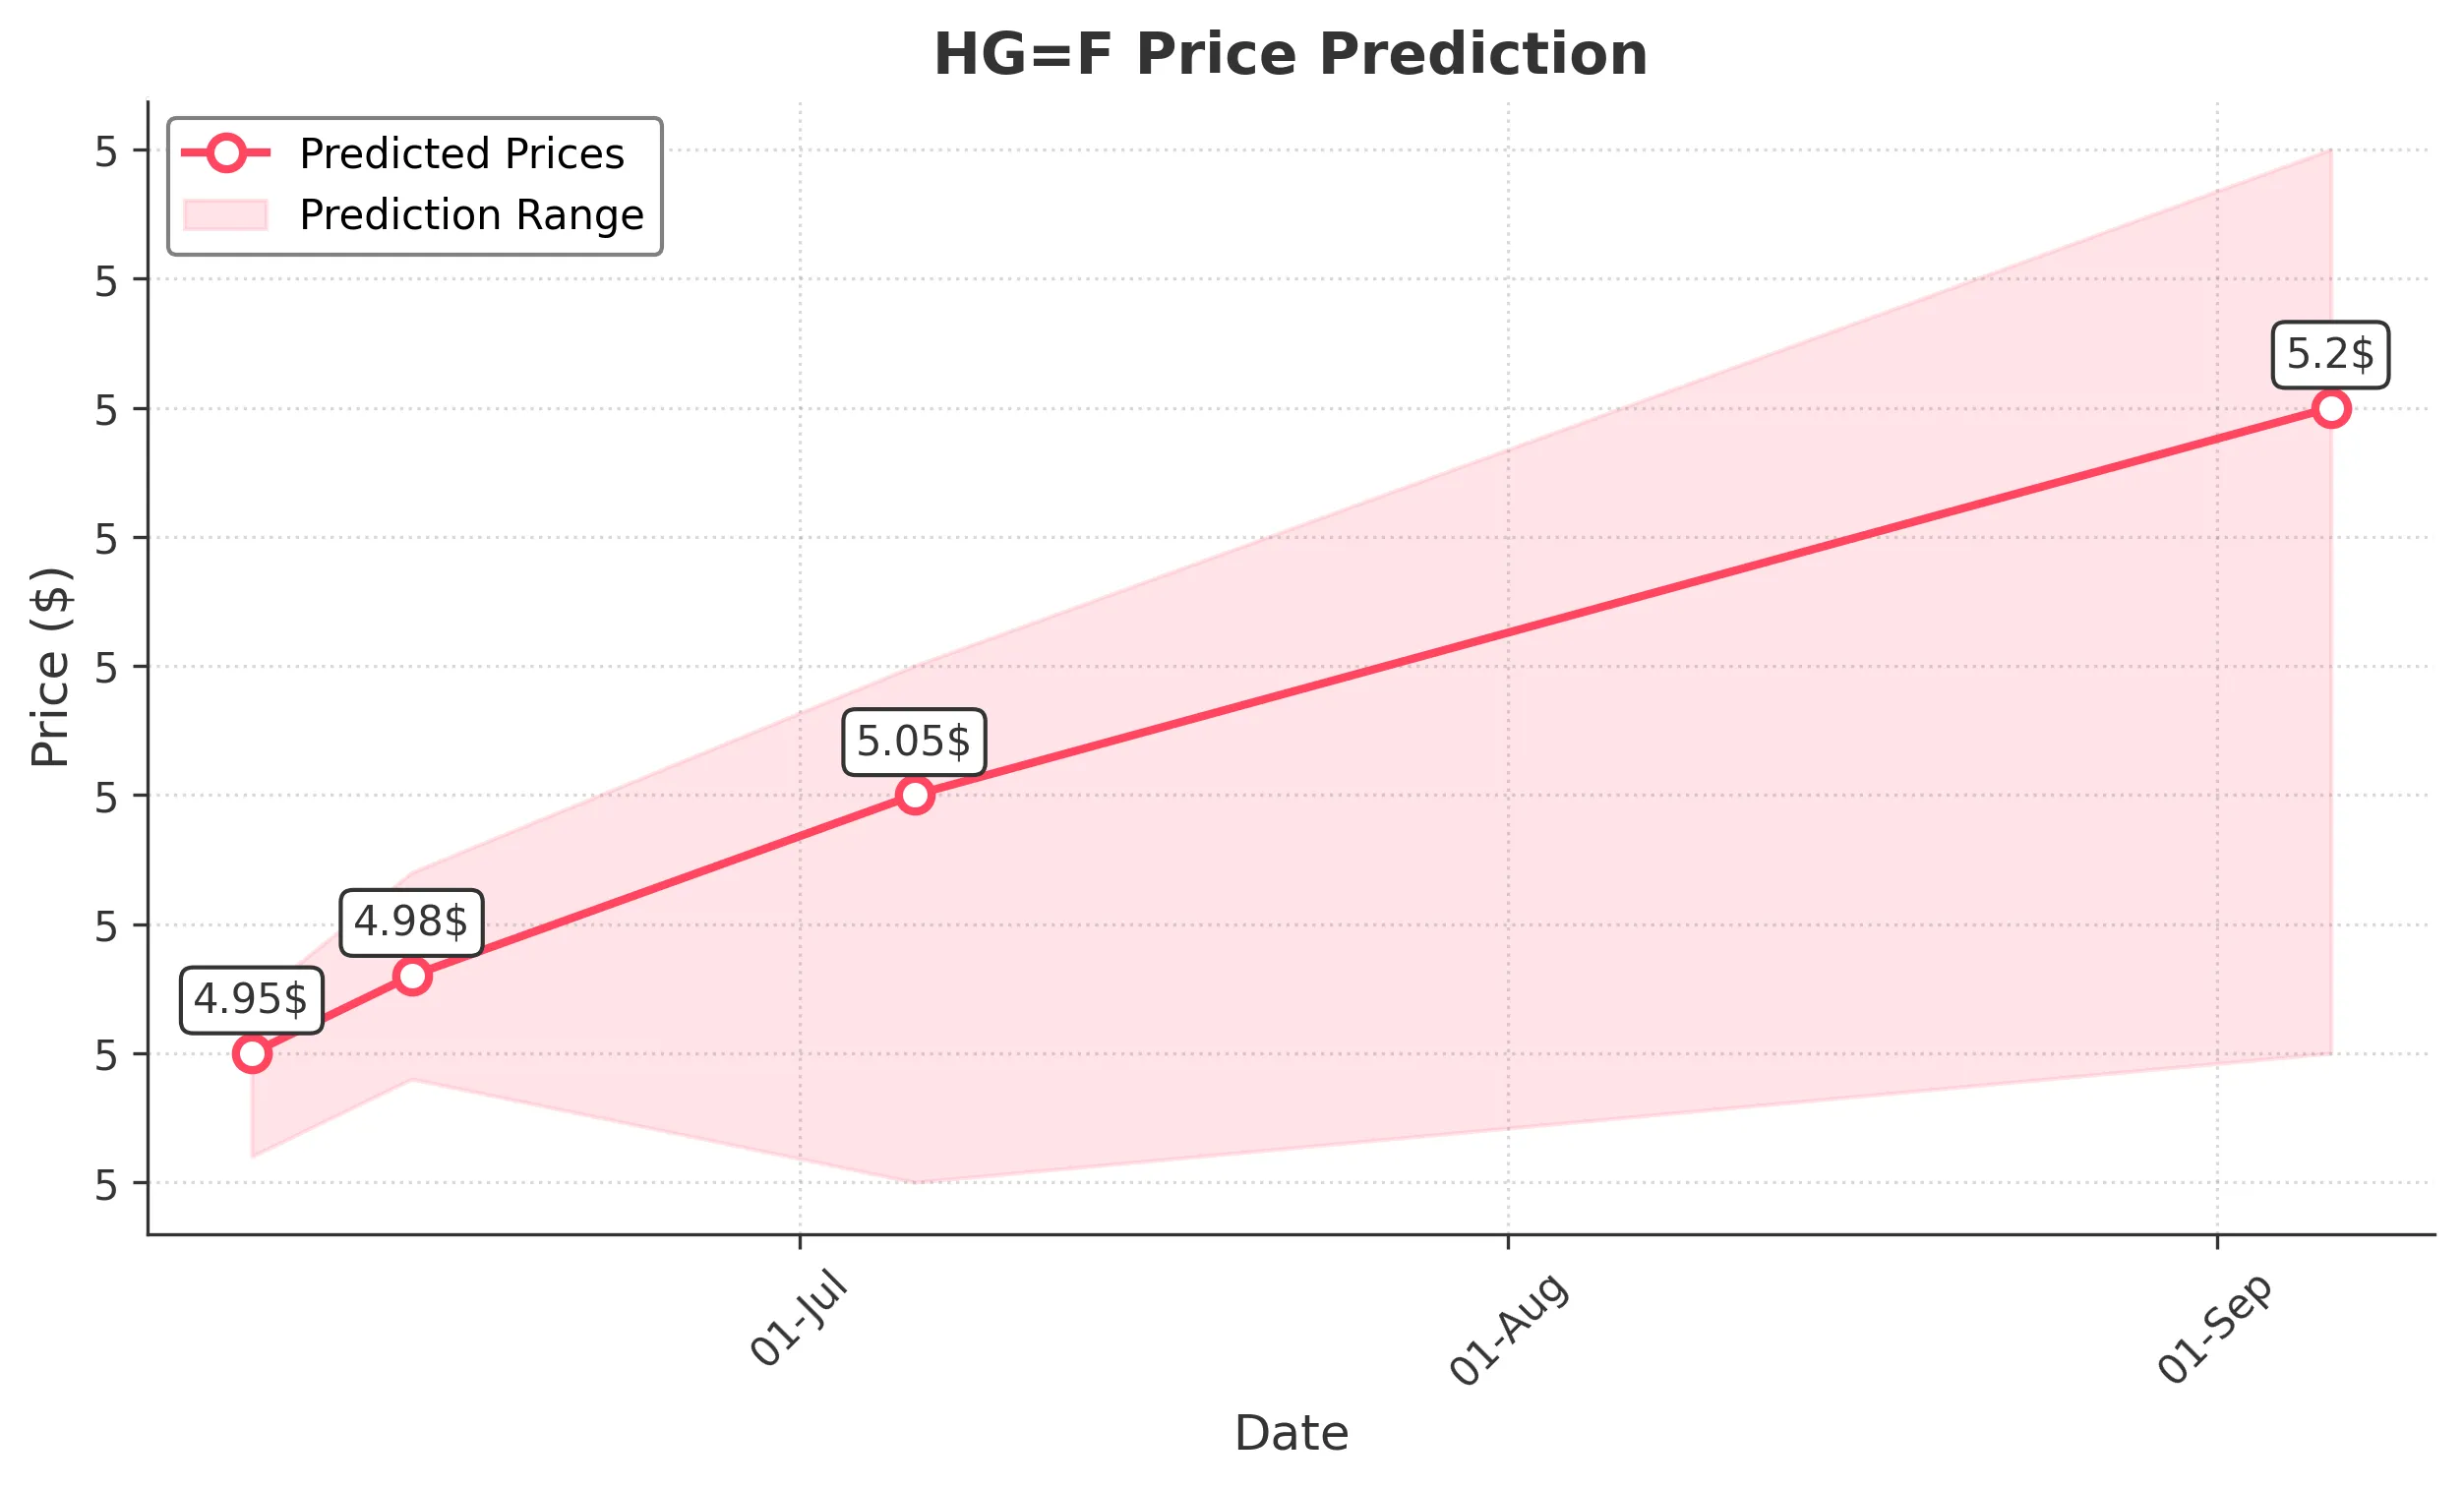
Target: June 7, 2025$4.95
$4.934
$4.97
$4.91
Description
The stock shows a bullish trend with a recent upward movement. The RSI is approaching overbought levels, indicating potential for a pullback. However, the MACD is positive, suggesting continued momentum. Expect slight fluctuations around the current price.
Analysis
Over the past 3 months, HG=F has shown a bullish trend with significant support at 4.60 and resistance around 5.00. The recent price action indicates a strong upward momentum, but the RSI nearing overbought levels suggests caution.
Confidence Level
Potential Risks
Potential market volatility and profit-taking could lead to a price drop.
1 Week Prediction
Target: June 14, 2025$4.98
$4.95
$5.02
$4.94
Description
The stock is expected to maintain its upward trajectory, supported by positive MACD and bullish candlestick patterns. However, the RSI indicates overbought conditions, which may lead to a correction. Watch for potential resistance at 5.00.
Analysis
The stock has been trending upward, with key support at 4.80. The recent volume spikes suggest increased interest, but the overbought RSI signals a possible pullback. The market's reaction to macroeconomic news could influence future performance.
Confidence Level
Potential Risks
Market sentiment could shift due to external factors, impacting the price.
1 Month Prediction
Target: July 6, 2025$5.05
$4.98
$5.1
$4.9
Description
The stock is likely to continue its upward trend, with strong support at 4.90. The MACD remains bullish, and the price may test the 5.10 resistance level. However, watch for potential corrections as the RSI approaches overbought territory.
Analysis
In the last three months, HG=F has shown a clear bullish trend, with significant resistance at 5.10. The stock's performance has been supported by positive volume trends, but the overbought RSI indicates a need for caution in the near term.
Confidence Level
Potential Risks
Unforeseen market events could lead to volatility and affect the price.
3 Months Prediction
Target: September 6, 2025$5.2
$5.05
$5.3
$4.95
Description
The stock is expected to maintain a bullish trend, potentially reaching 5.20. The MACD remains positive, indicating continued momentum. However, the RSI may signal overbought conditions, suggesting a possible correction before reaching this target.
Analysis
The stock has shown a strong upward trend over the past three months, with key support at 5.00. The bullish MACD and volume trends support further price increases, but the potential for market corrections remains a risk.
Confidence Level
Potential Risks
Market fluctuations and economic indicators could impact the stock's performance.