HGF Trading Predictions
1 Day Prediction
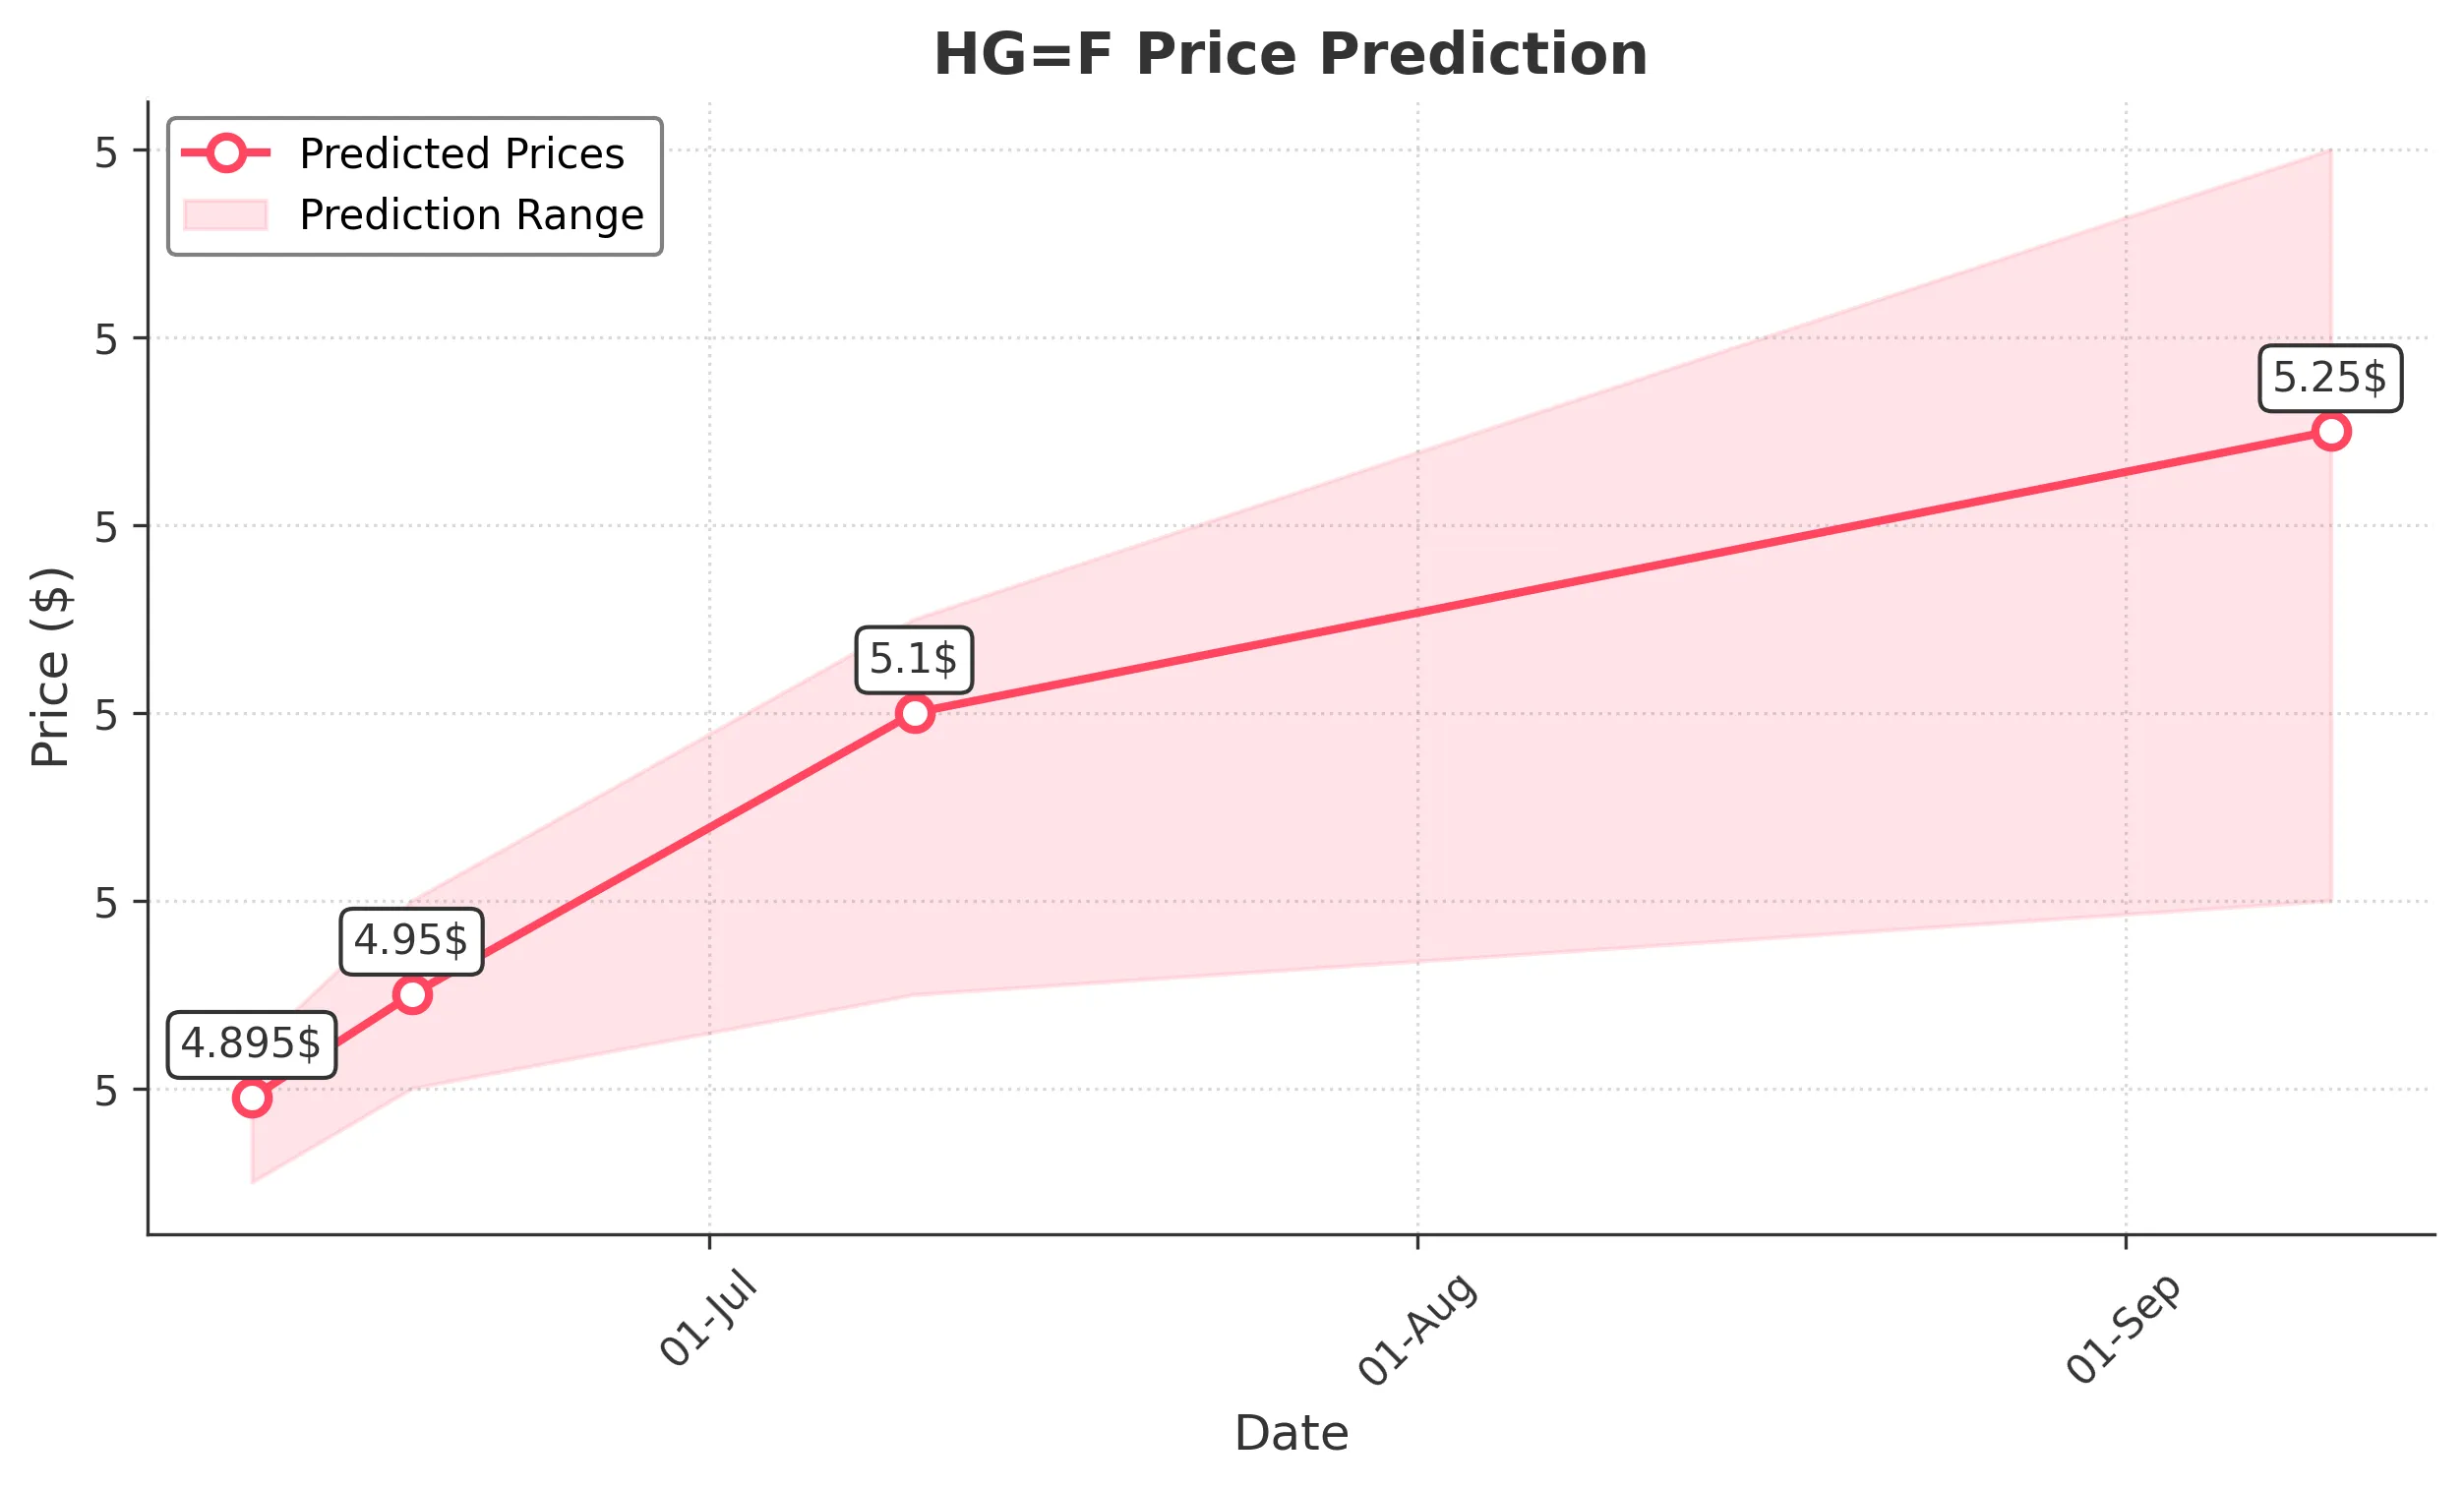
Target: June 11, 2025$4.895
$4.885
$4.92
$4.85
Description
The stock shows a slight bullish trend with a recent upward movement. The RSI is near 60, indicating potential for further gains. However, the MACD is flattening, suggesting caution. A Doji pattern indicates indecision, which could lead to volatility.
Analysis
Over the past 3 months, HG=F has shown a bullish trend with significant support at 4.60 and resistance around 5.00. The MACD indicates momentum, while the RSI suggests overbought conditions. Volume has been inconsistent, with spikes indicating interest. Overall, the market sentiment remains cautiously optimistic.
Confidence Level
Potential Risks
Market sentiment could shift due to external factors, and the recent Doji pattern suggests potential for reversal.
1 Week Prediction
Target: June 18, 2025$4.95
$4.925
$5
$4.9
Description
The stock is expected to continue its upward trajectory, supported by a bullish MACD crossover. The Bollinger Bands are widening, indicating potential for price movement. However, the RSI nearing 70 suggests overbought conditions, which could lead to a pullback.
Analysis
The stock has been in a bullish phase, with key support at 4.80 and resistance at 5.00. The recent price action shows higher highs and higher lows, indicating strong buying interest. However, the RSI indicates potential overbought conditions, warranting caution.
Confidence Level
Potential Risks
Potential for a pullback exists if the RSI remains overbought, and external market conditions could impact performance.
1 Month Prediction
Target: July 10, 2025$5.1
$5.05
$5.15
$4.95
Description
The stock is projected to reach new highs as bullish momentum continues. The Fibonacci retracement levels suggest a target around 5.10. However, the RSI indicates potential overbought conditions, which could lead to volatility.
Analysis
The stock has shown a strong upward trend, with significant resistance at 5.10. The MACD indicates bullish momentum, but the RSI suggests caution due to overbought conditions. Volume patterns indicate interest, but external factors could introduce volatility.
Confidence Level
Potential Risks
Market volatility and external economic factors could impact the stock's performance, leading to potential corrections.
3 Months Prediction
Target: September 10, 2025$5.25
$5.2
$5.4
$5
Description
The stock is expected to maintain a bullish trend, with potential to reach 5.25. The MACD remains positive, and the RSI is expected to stabilize. However, external economic conditions could introduce volatility.
Analysis
Over the past 3 months, HG=F has shown a bullish trend with key support at 5.00 and resistance at 5.25. The MACD indicates sustained momentum, but the RSI suggests caution. Volume patterns show interest, but external factors could introduce volatility.
Confidence Level
Potential Risks
Unforeseen macroeconomic events or shifts in market sentiment could lead to price corrections.