HGF Trading Predictions
1 Day Prediction
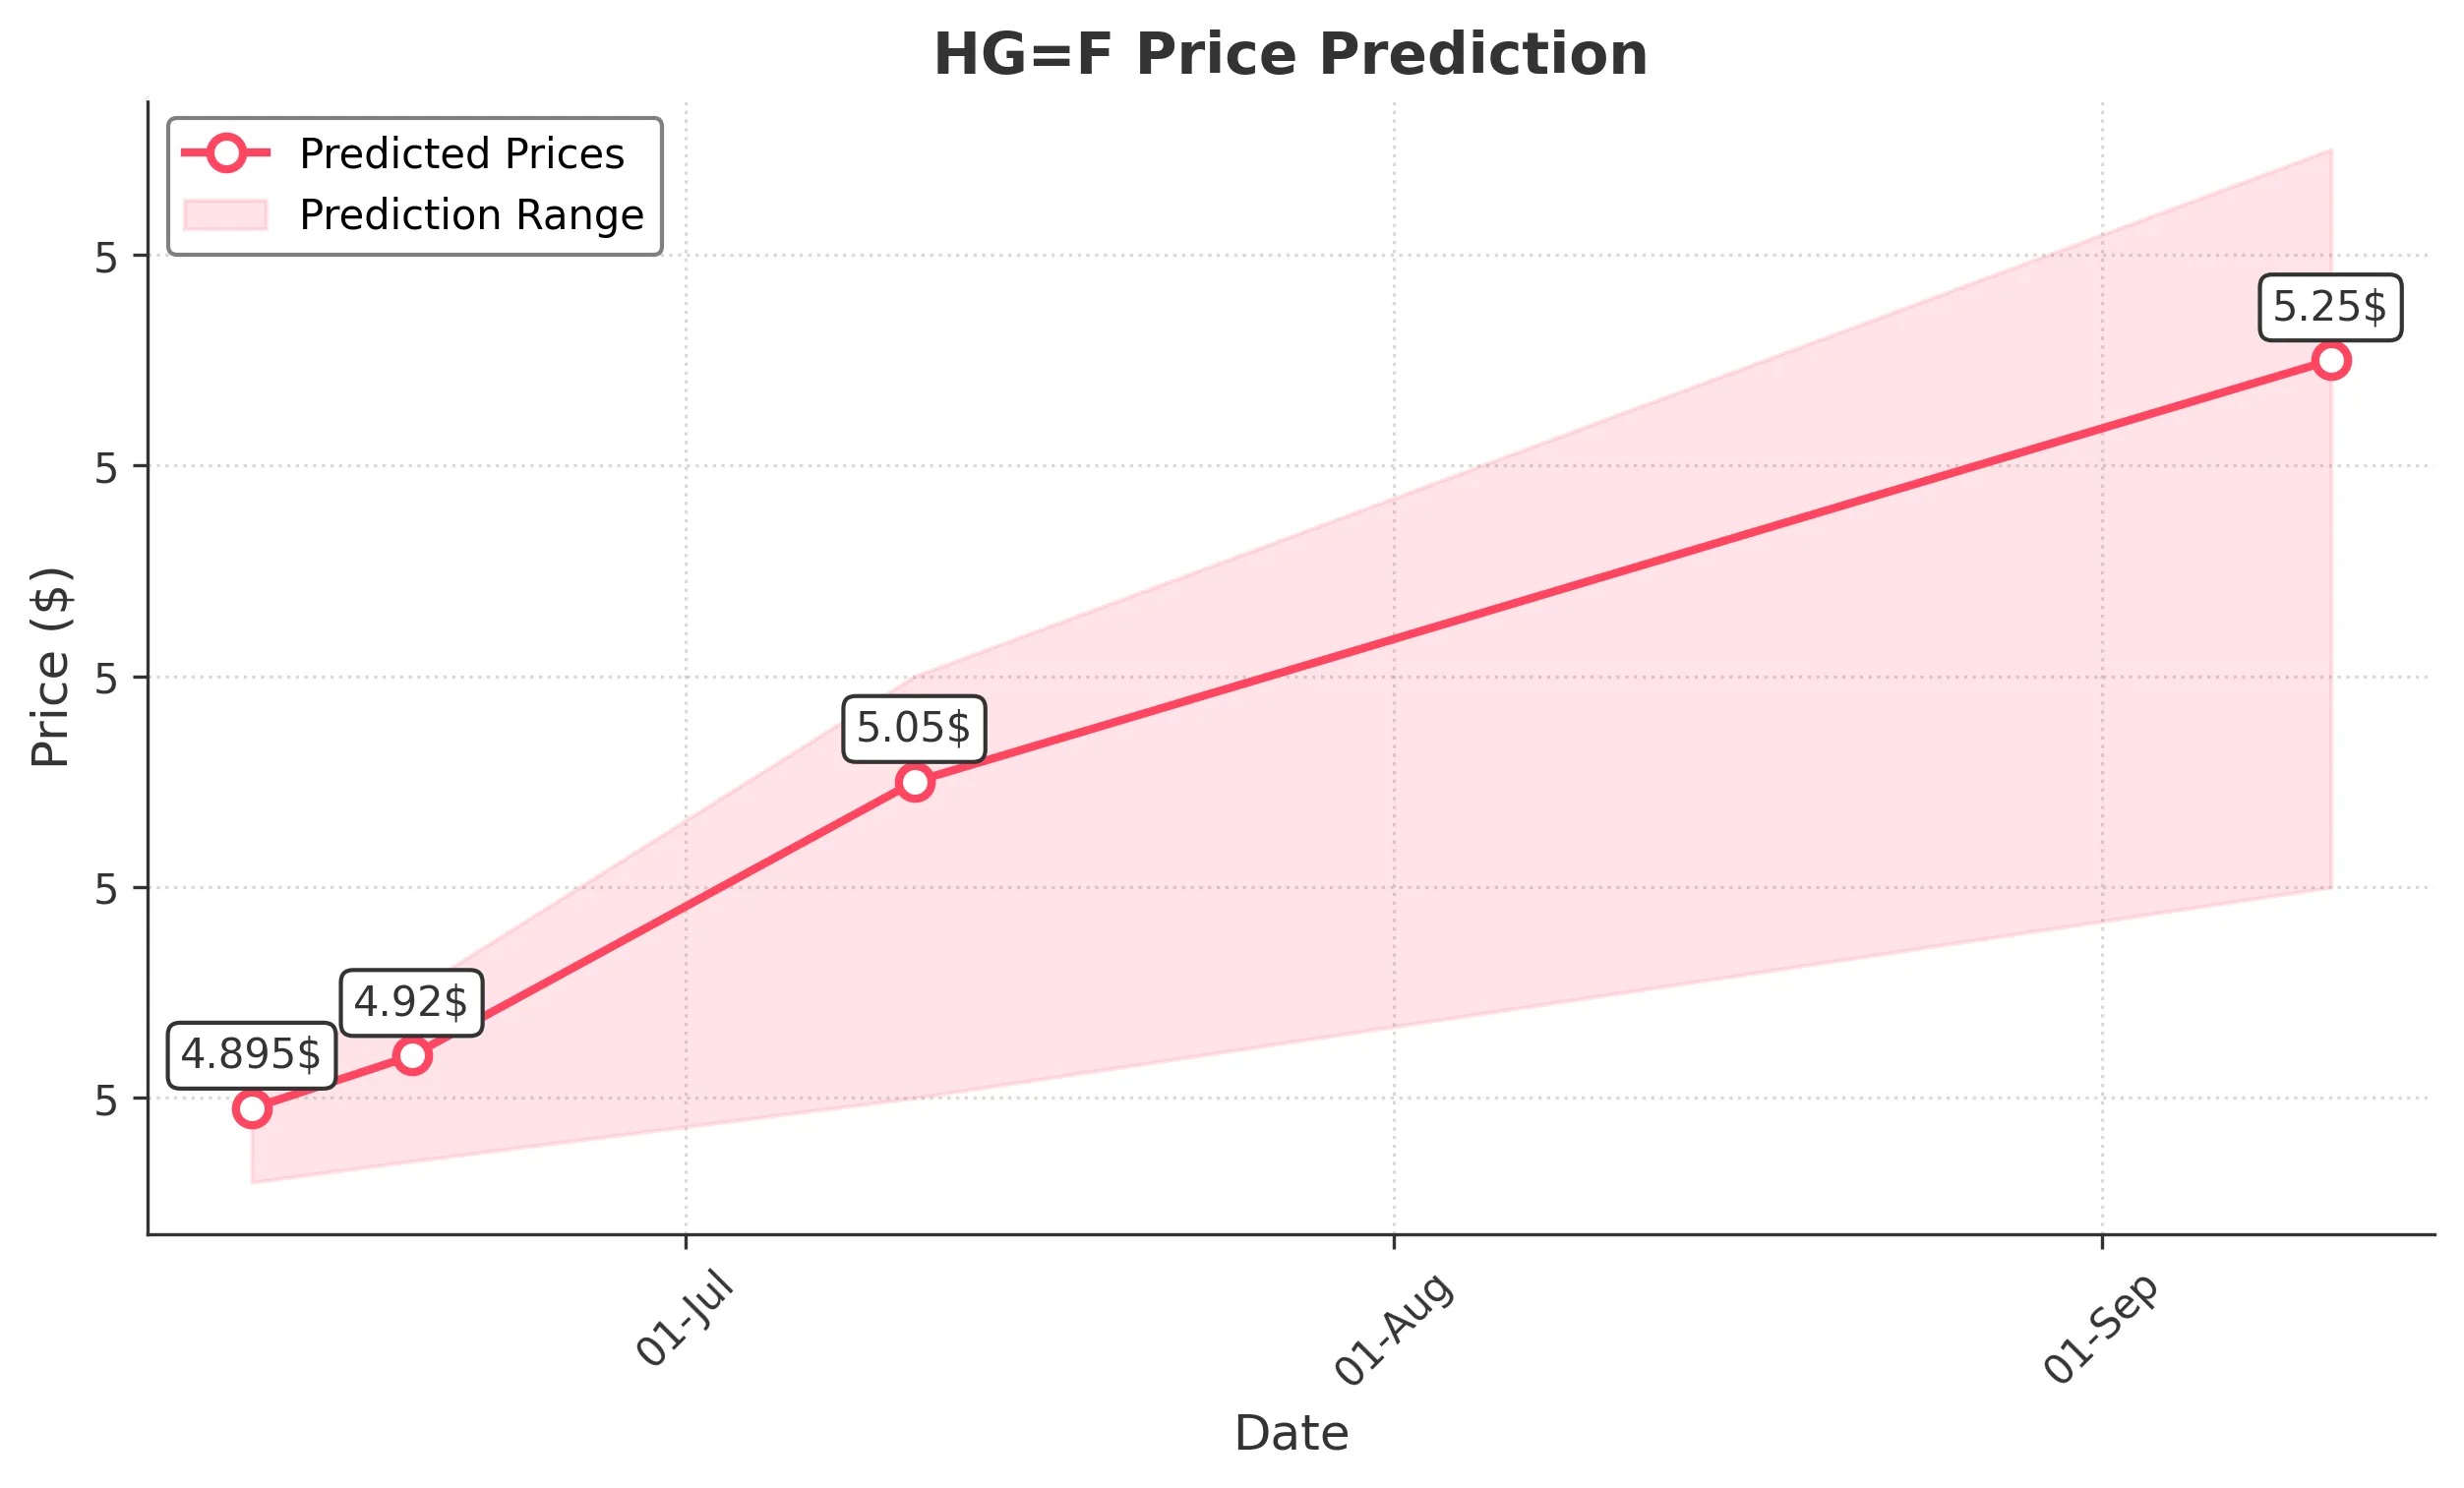
Target: June 12, 2025$4.895
$4.885
$4.91
$4.86
Description
The stock shows a slight bullish trend with a recent close of 4.8955. The RSI is neutral, and MACD indicates potential upward momentum. However, volatility remains, suggesting caution. Expect minor fluctuations.
Analysis
Over the past 3 months, HG=F has shown a bullish trend with significant support around 4.80. The recent price action indicates consolidation, with RSI hovering around neutral levels. Volume has been stable, but spikes were noted during key price movements.
Confidence Level
Potential Risks
Market sentiment could shift due to external factors, impacting the prediction.
1 Week Prediction
Target: June 19, 2025$4.92
$4.895
$4.95
$4.87
Description
The stock is expected to continue its upward trajectory, supported by recent bullish candlestick patterns. The MACD is showing a bullish crossover, indicating potential for further gains. Watch for resistance at 4.95.
Analysis
The stock has been in a bullish phase, with key support at 4.80 and resistance at 4.95. The MACD and moving averages suggest upward momentum, while volume patterns indicate healthy trading activity.
Confidence Level
Potential Risks
Potential market corrections or external economic news could impact the price.
1 Month Prediction
Target: July 11, 2025$5.05
$4.95
$5.1
$4.9
Description
With the current bullish trend and positive technical indicators, the stock is likely to reach 5.05. The RSI is approaching overbought territory, suggesting caution. A pullback could occur if resistance at 5.10 holds.
Analysis
The stock has shown a strong upward trend, with significant support at 4.80. The RSI indicates potential overbought conditions, while the MACD supports continued bullish momentum. Volume has been consistent, indicating investor interest.
Confidence Level
Potential Risks
Market volatility and economic data releases could lead to unexpected price movements.
3 Months Prediction
Target: September 11, 2025$5.25
$5.1
$5.35
$5
Description
The stock is projected to reach 5.25, driven by sustained bullish sentiment and positive macroeconomic indicators. However, the RSI may indicate overbought conditions, suggesting a potential correction could follow.
Analysis
Over the past three months, HG=F has demonstrated a bullish trend with key support at 4.80 and resistance at 5.10. The MACD and moving averages indicate continued upward momentum, but caution is warranted due to potential overbought signals.
Confidence Level
Potential Risks
Unforeseen economic events or shifts in market sentiment could lead to volatility.