HGF Trading Predictions
1 Day Prediction
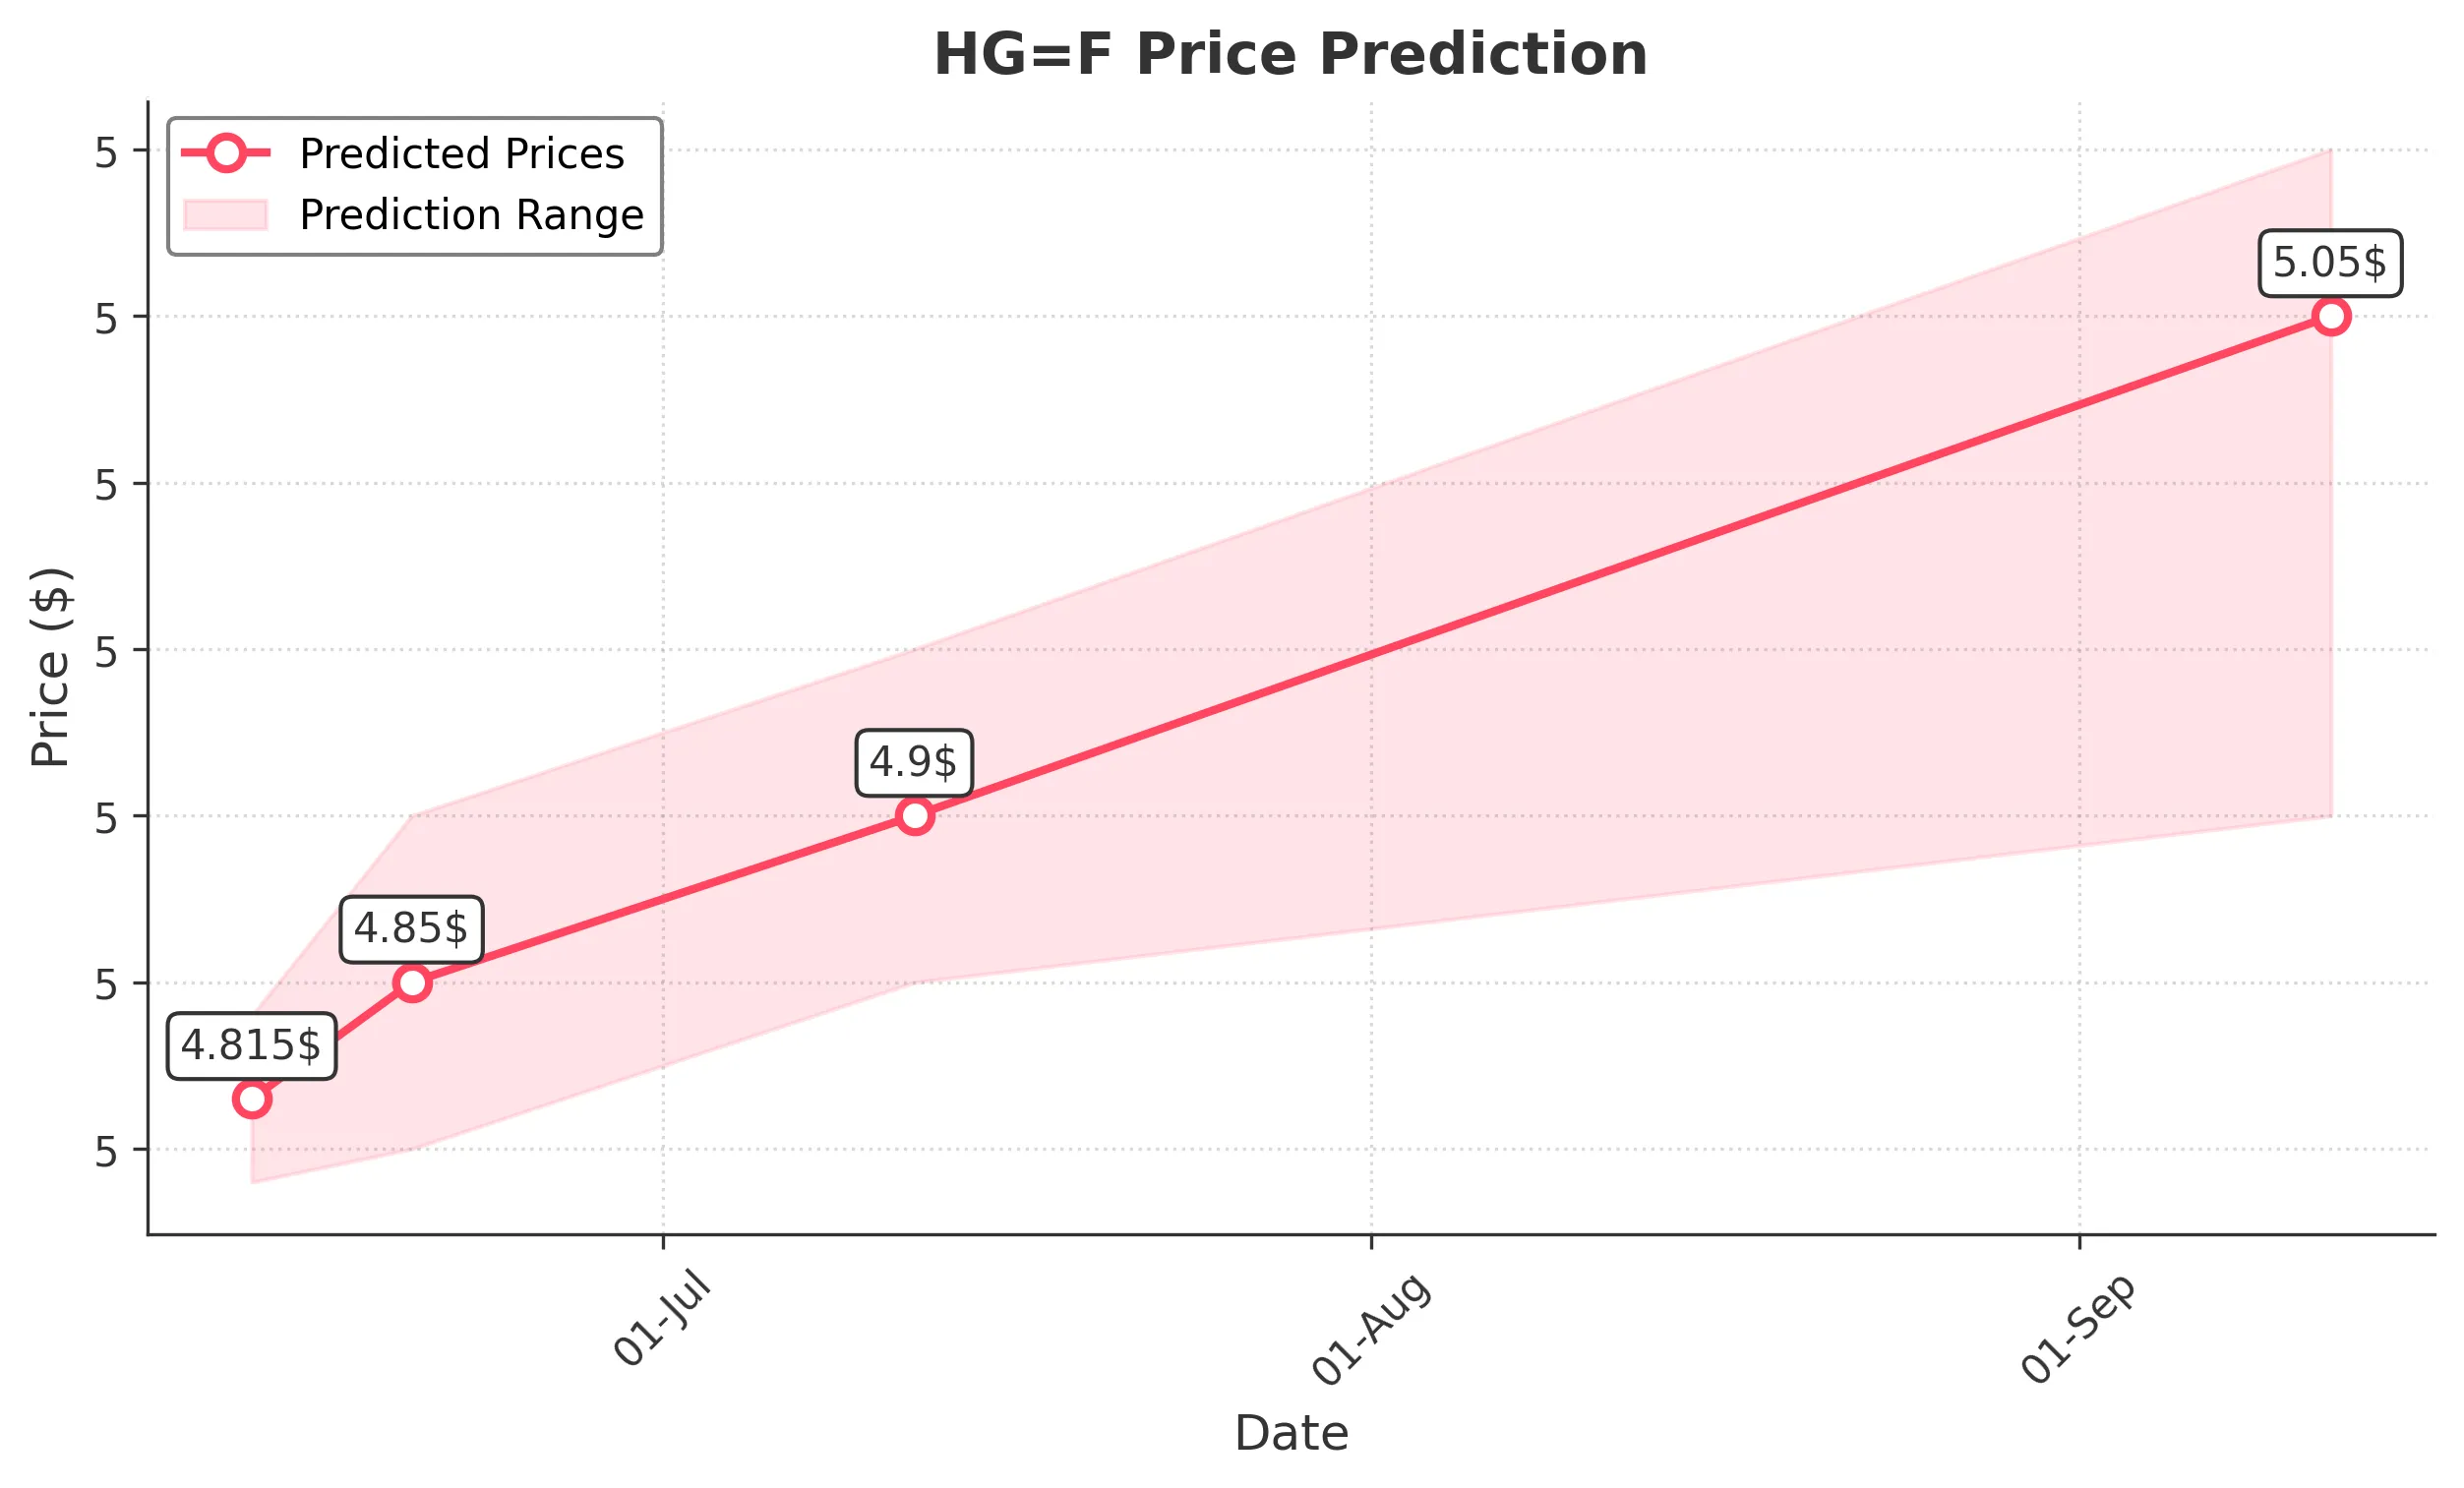
Target: June 13, 2025$4.815
$4.81
$4.84
$4.79
Description
The stock shows a slight bullish trend with a recent Doji candlestick indicating indecision. The RSI is neutral, and MACD is close to crossing above the signal line, suggesting potential upward momentum. However, volatility remains a concern.
Analysis
Over the past 3 months, HG=F has shown a mix of bullish and bearish trends, with significant support around 4.80 and resistance near 5.00. The RSI has fluctuated, indicating periods of overbought and oversold conditions. Volume has been inconsistent, with spikes suggesting speculative trading.
Confidence Level
Potential Risks
Market sentiment could shift due to external factors, and the recent volatility may lead to unexpected price movements.
1 Week Prediction
Target: June 20, 2025$4.85
$4.83
$4.9
$4.8
Description
The stock is expected to continue its upward trend, supported by a bullish MACD crossover and a recent bullish engulfing pattern. The Bollinger Bands indicate potential for upward movement, but caution is advised due to recent volatility.
Analysis
The stock has been in a bullish phase recently, with key support at 4.80 and resistance at 5.00. The MACD and RSI indicate bullish momentum, but the ATR suggests increased volatility. Volume patterns show some accumulation, indicating investor interest.
Confidence Level
Potential Risks
Potential market corrections or negative news could impact the stock's performance, leading to unexpected declines.
1 Month Prediction
Target: July 12, 2025$4.9
$4.87
$4.95
$4.85
Description
The stock is likely to maintain its upward trajectory, supported by a bullish trend in moving averages. The RSI is approaching overbought territory, indicating potential for a pullback. Market sentiment remains cautiously optimistic.
Analysis
In the last three months, HG=F has shown a bullish trend with significant resistance at 5.00. The moving averages indicate a positive trend, while the RSI suggests caution as it nears overbought levels. Volume has been increasing, indicating strong interest.
Confidence Level
Potential Risks
Economic indicators or geopolitical events could negatively impact market sentiment, leading to price corrections.
3 Months Prediction
Target: September 12, 2025$5.05
$4.95
$5.1
$4.9
Description
The stock is expected to reach new highs, driven by positive market sentiment and strong technical indicators. However, the RSI indicates potential overbought conditions, suggesting a possible correction in the near term.
Analysis
The overall trend for HG=F has been bullish, with key support at 4.80 and resistance at 5.00. The MACD and moving averages support upward momentum, but the RSI nearing overbought levels raises concerns about potential pullbacks. Volume trends indicate strong investor interest.
Confidence Level
Potential Risks
Unforeseen macroeconomic events or changes in market sentiment could lead to volatility and price corrections.