HGF Trading Predictions
1 Day Prediction
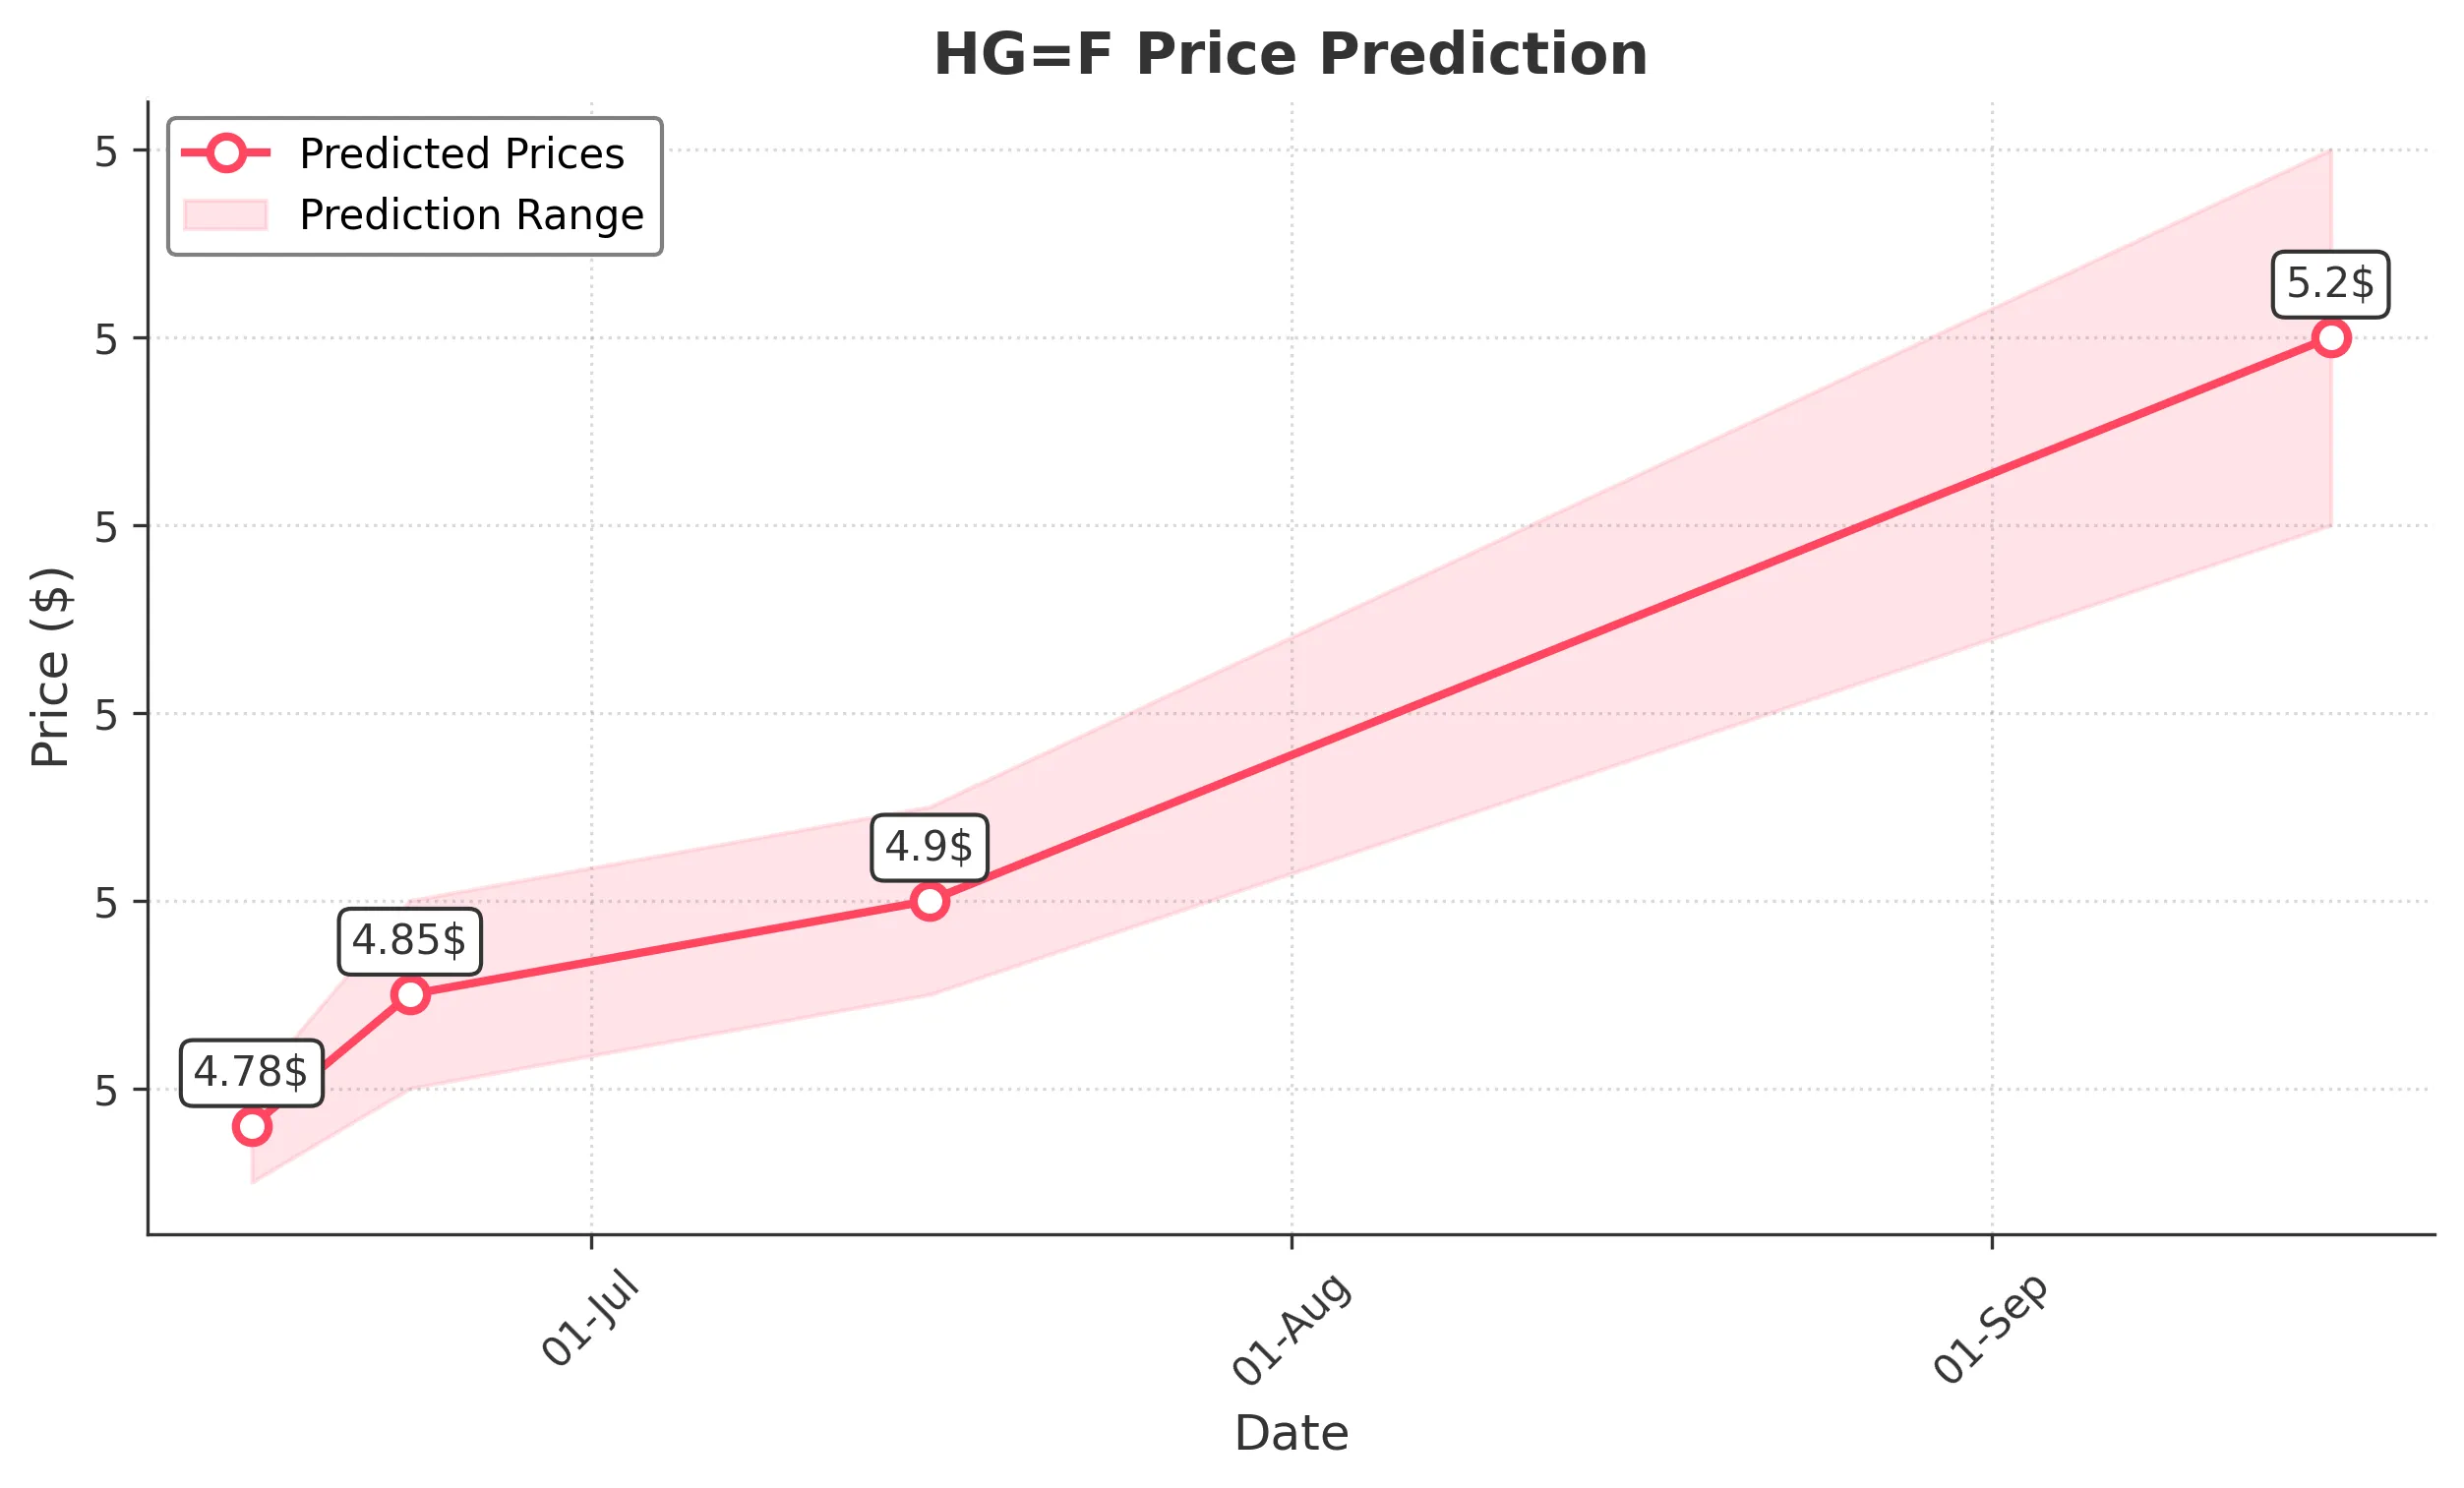
Target: June 16, 2025$4.78
$4.77
$4.8
$4.75
Description
The stock shows a slight bullish trend with a recent Doji pattern indicating indecision. RSI is neutral, and MACD is close to crossing above the signal line, suggesting potential upward movement. However, volatility remains a concern.
Analysis
Over the past 3 months, HG=F has shown a bearish trend with significant support around 4.75. Recent price action indicates a potential reversal, but the overall sentiment remains cautious. Volume has been inconsistent, and technical indicators suggest mixed signals.
Confidence Level
Potential Risks
Market sentiment could shift due to external factors, and a reversal is possible if selling pressure increases.
1 Week Prediction
Target: June 23, 2025$4.85
$4.83
$4.9
$4.8
Description
A bullish engulfing pattern suggests a potential upward trend. The MACD is showing signs of bullish momentum, and the RSI is approaching overbought territory. However, caution is advised as the market remains volatile.
Analysis
The stock has been fluctuating around the 4.75 support level, with recent bullish signals. However, the overall trend remains uncertain, and external factors could influence price movements. Volume spikes indicate increased interest but also potential for volatility.
Confidence Level
Potential Risks
Potential market corrections could impact the upward momentum, and external economic factors may introduce volatility.
1 Month Prediction
Target: July 16, 2025$4.9
$4.87
$4.95
$4.85
Description
The stock is expected to continue its upward trajectory, supported by recent bullish patterns and a favorable MACD crossover. However, the RSI indicates potential overbought conditions, which could lead to a pullback.
Analysis
The past three months have shown a bearish trend with recent signs of recovery. Key resistance levels are around 4.90, and the stock's performance is influenced by broader market conditions. Volume trends suggest cautious optimism.
Confidence Level
Potential Risks
Market corrections and external economic news could lead to unexpected volatility, impacting the predicted price.
3 Months Prediction
Target: September 16, 2025$5.2
$5.15
$5.3
$5.1
Description
Long-term indicators suggest a bullish trend as the stock breaks above key resistance levels. The MACD is expected to maintain upward momentum, and the RSI may stabilize after potential overbought conditions.
Analysis
The stock has shown volatility with a recent shift towards bullish patterns. Key resistance levels are being tested, and while there are signs of recovery, external economic factors could heavily influence future performance.
Confidence Level
Potential Risks
Long-term predictions are subject to significant market fluctuations and economic changes that could alter the trajectory.