HGF Trading Predictions
1 Day Prediction
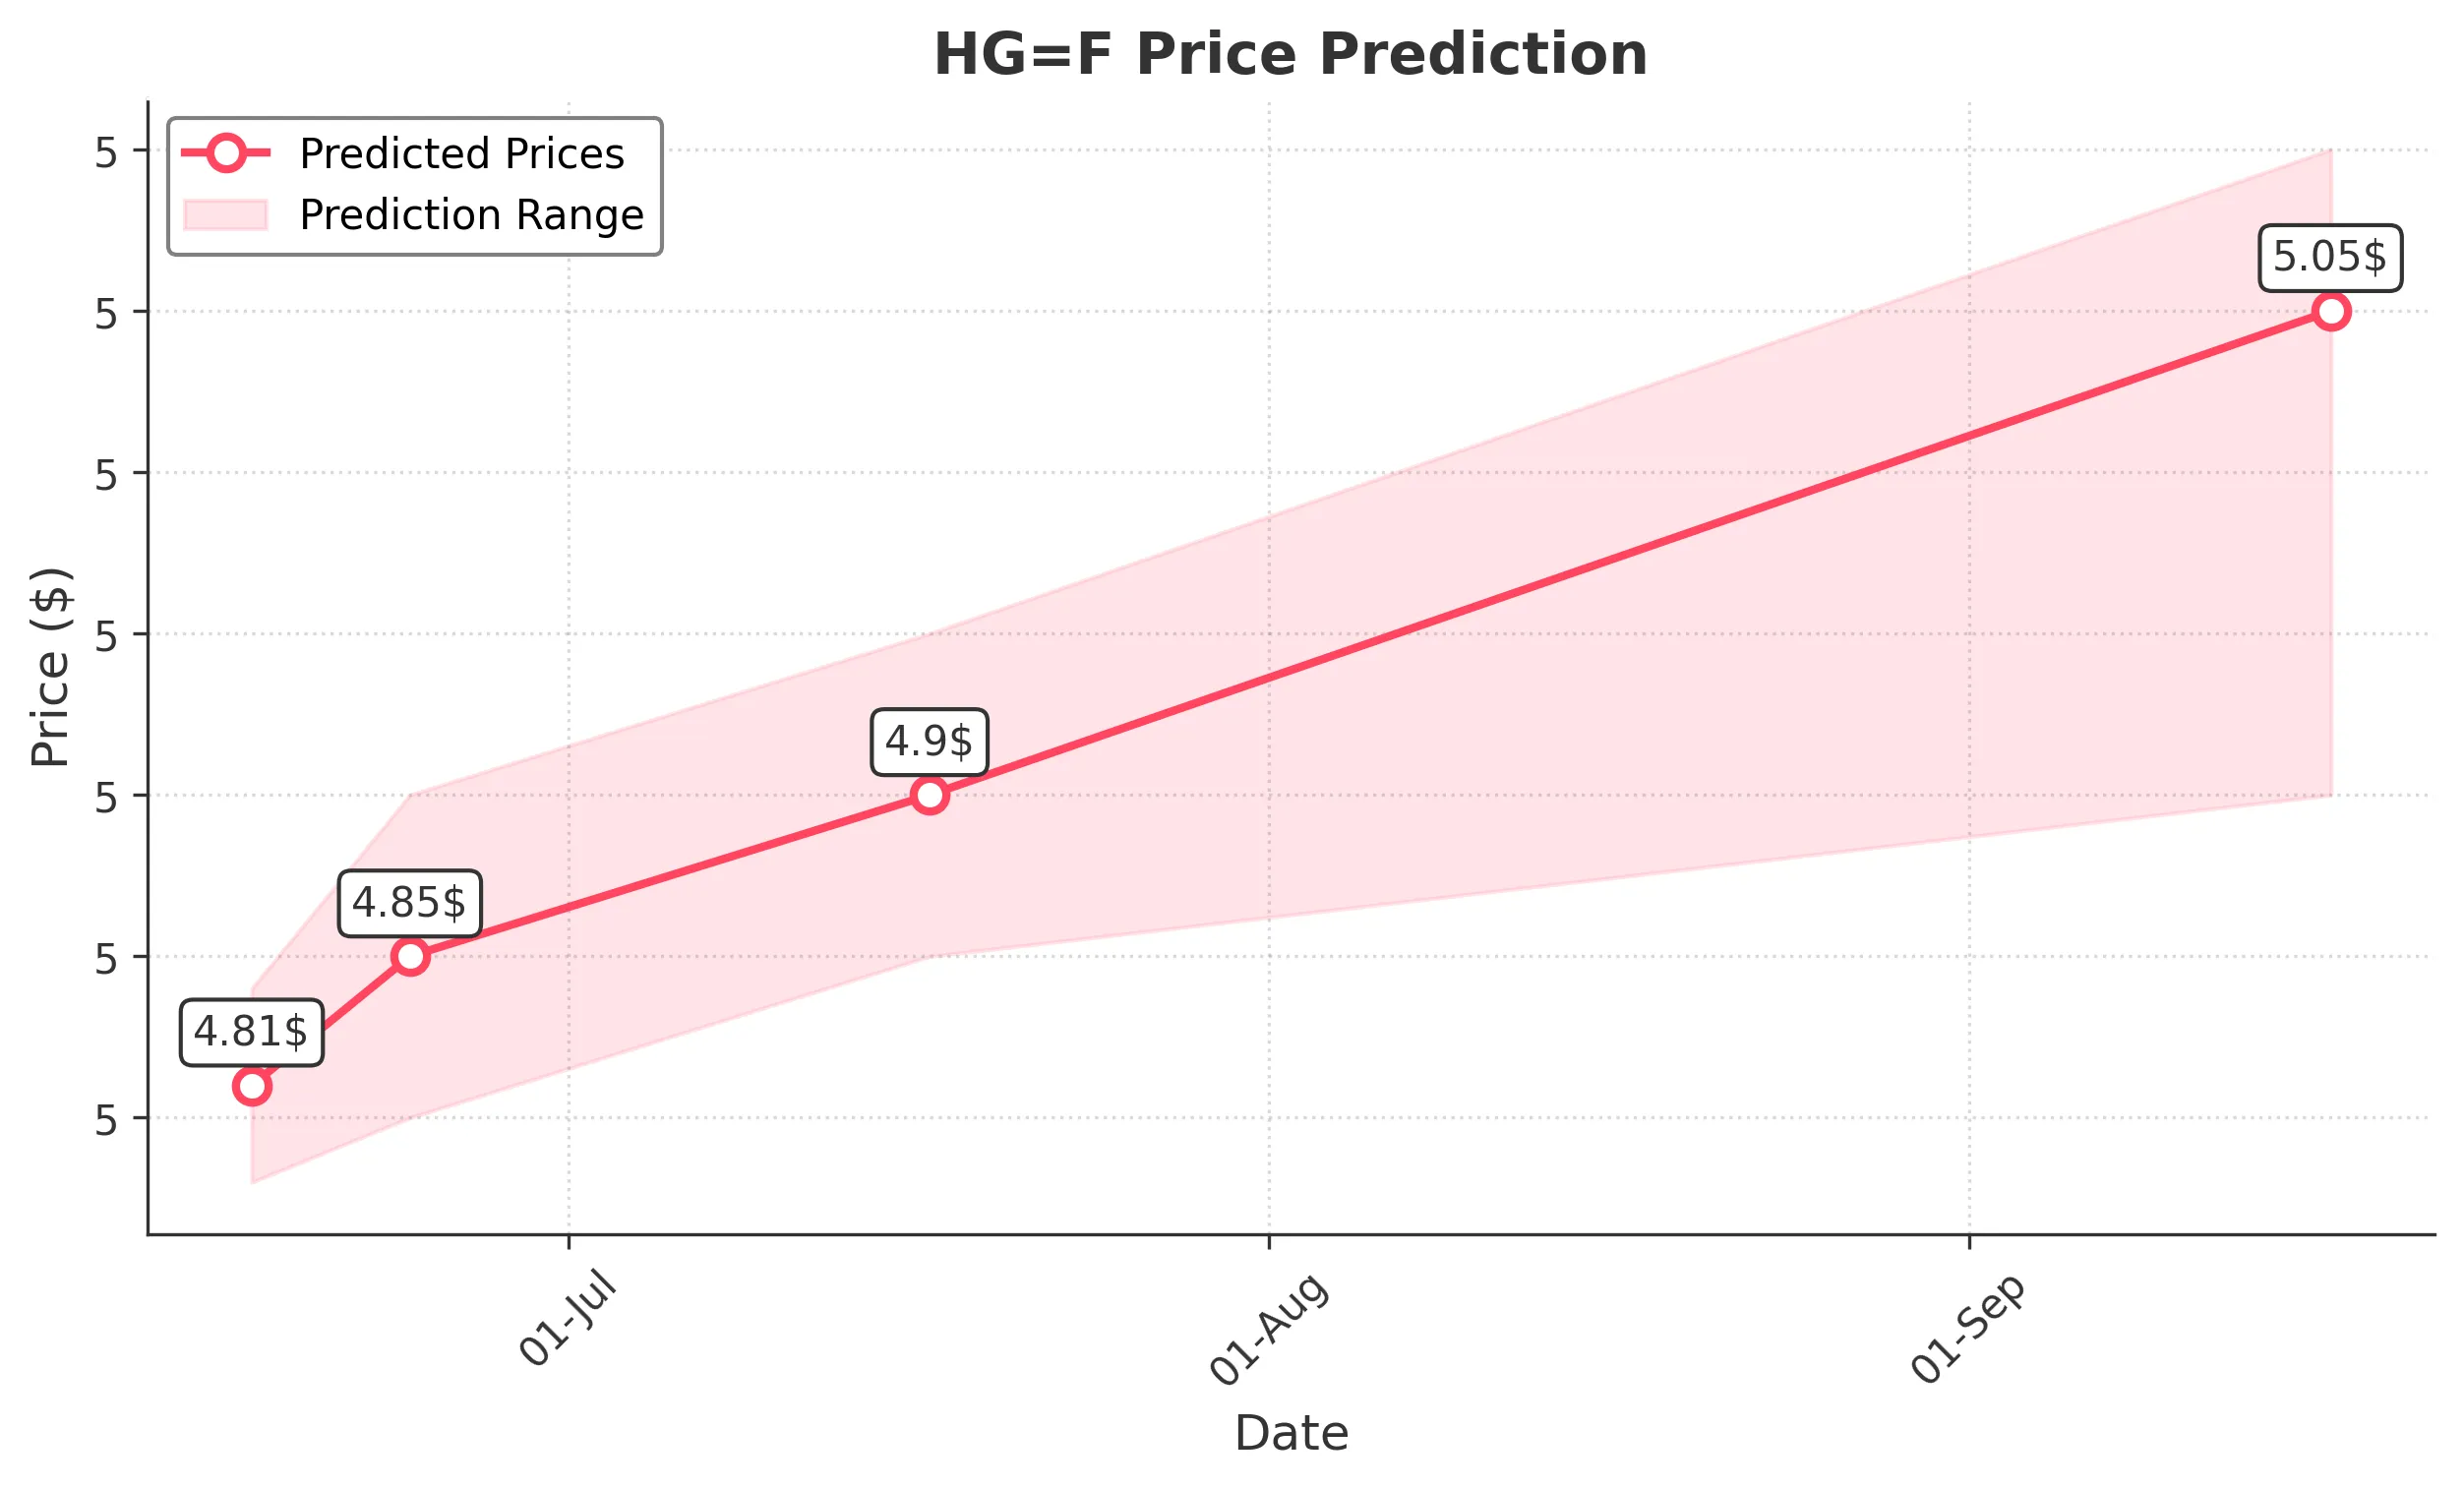
Target: June 17, 2025$4.81
$4.803
$4.84
$4.78
Description
The stock shows a slight bullish trend with a recent Doji pattern indicating indecision. The RSI is neutral, suggesting potential for upward movement. However, recent volatility may lead to a pullback.
Analysis
Over the past 3 months, HG=F has shown a bearish trend with significant fluctuations. Key support at 4.80 and resistance at 5.00. The RSI indicates neutral momentum, while volume spikes suggest potential reversals.
Confidence Level
Potential Risks
Market sentiment could shift due to external factors, and the recent volatility may lead to unexpected price movements.
1 Week Prediction
Target: June 24, 2025$4.85
$4.81
$4.9
$4.8
Description
The stock is expected to trend upwards as it approaches resistance levels. The MACD shows a bullish crossover, and the Bollinger Bands indicate potential for a breakout. However, watch for volume trends.
Analysis
The stock has been in a sideways trend recently, with key support at 4.80. The MACD and RSI suggest potential upward momentum, but external factors could impact performance.
Confidence Level
Potential Risks
If market conditions change or if there are negative macroeconomic events, the prediction may not hold.
1 Month Prediction
Target: July 17, 2025$4.9
$4.85
$4.95
$4.85
Description
A gradual upward trend is anticipated as the stock approaches key Fibonacci retracement levels. The RSI indicates bullish momentum, but caution is advised due to potential resistance.
Analysis
The stock has shown a mix of bullish and bearish signals. Key resistance at 5.00 and support at 4.80. The recent volume trends suggest cautious optimism, but external factors could influence the market.
Confidence Level
Potential Risks
Market volatility and economic indicators could lead to unexpected price movements.
3 Months Prediction
Target: September 17, 2025$5.05
$4.95
$5.1
$4.9
Description
Long-term bullish sentiment is expected as the stock breaks through resistance levels. The MACD and moving averages indicate a strong upward trend, but external economic factors could pose risks.
Analysis
The stock has shown a bullish trend with key support at 4.80 and resistance at 5.00. The MACD and moving averages suggest upward momentum, but external factors could lead to volatility.
Confidence Level
Potential Risks
Potential market corrections and economic downturns could impact the stock's performance.