HGF Trading Predictions
1 Day Prediction
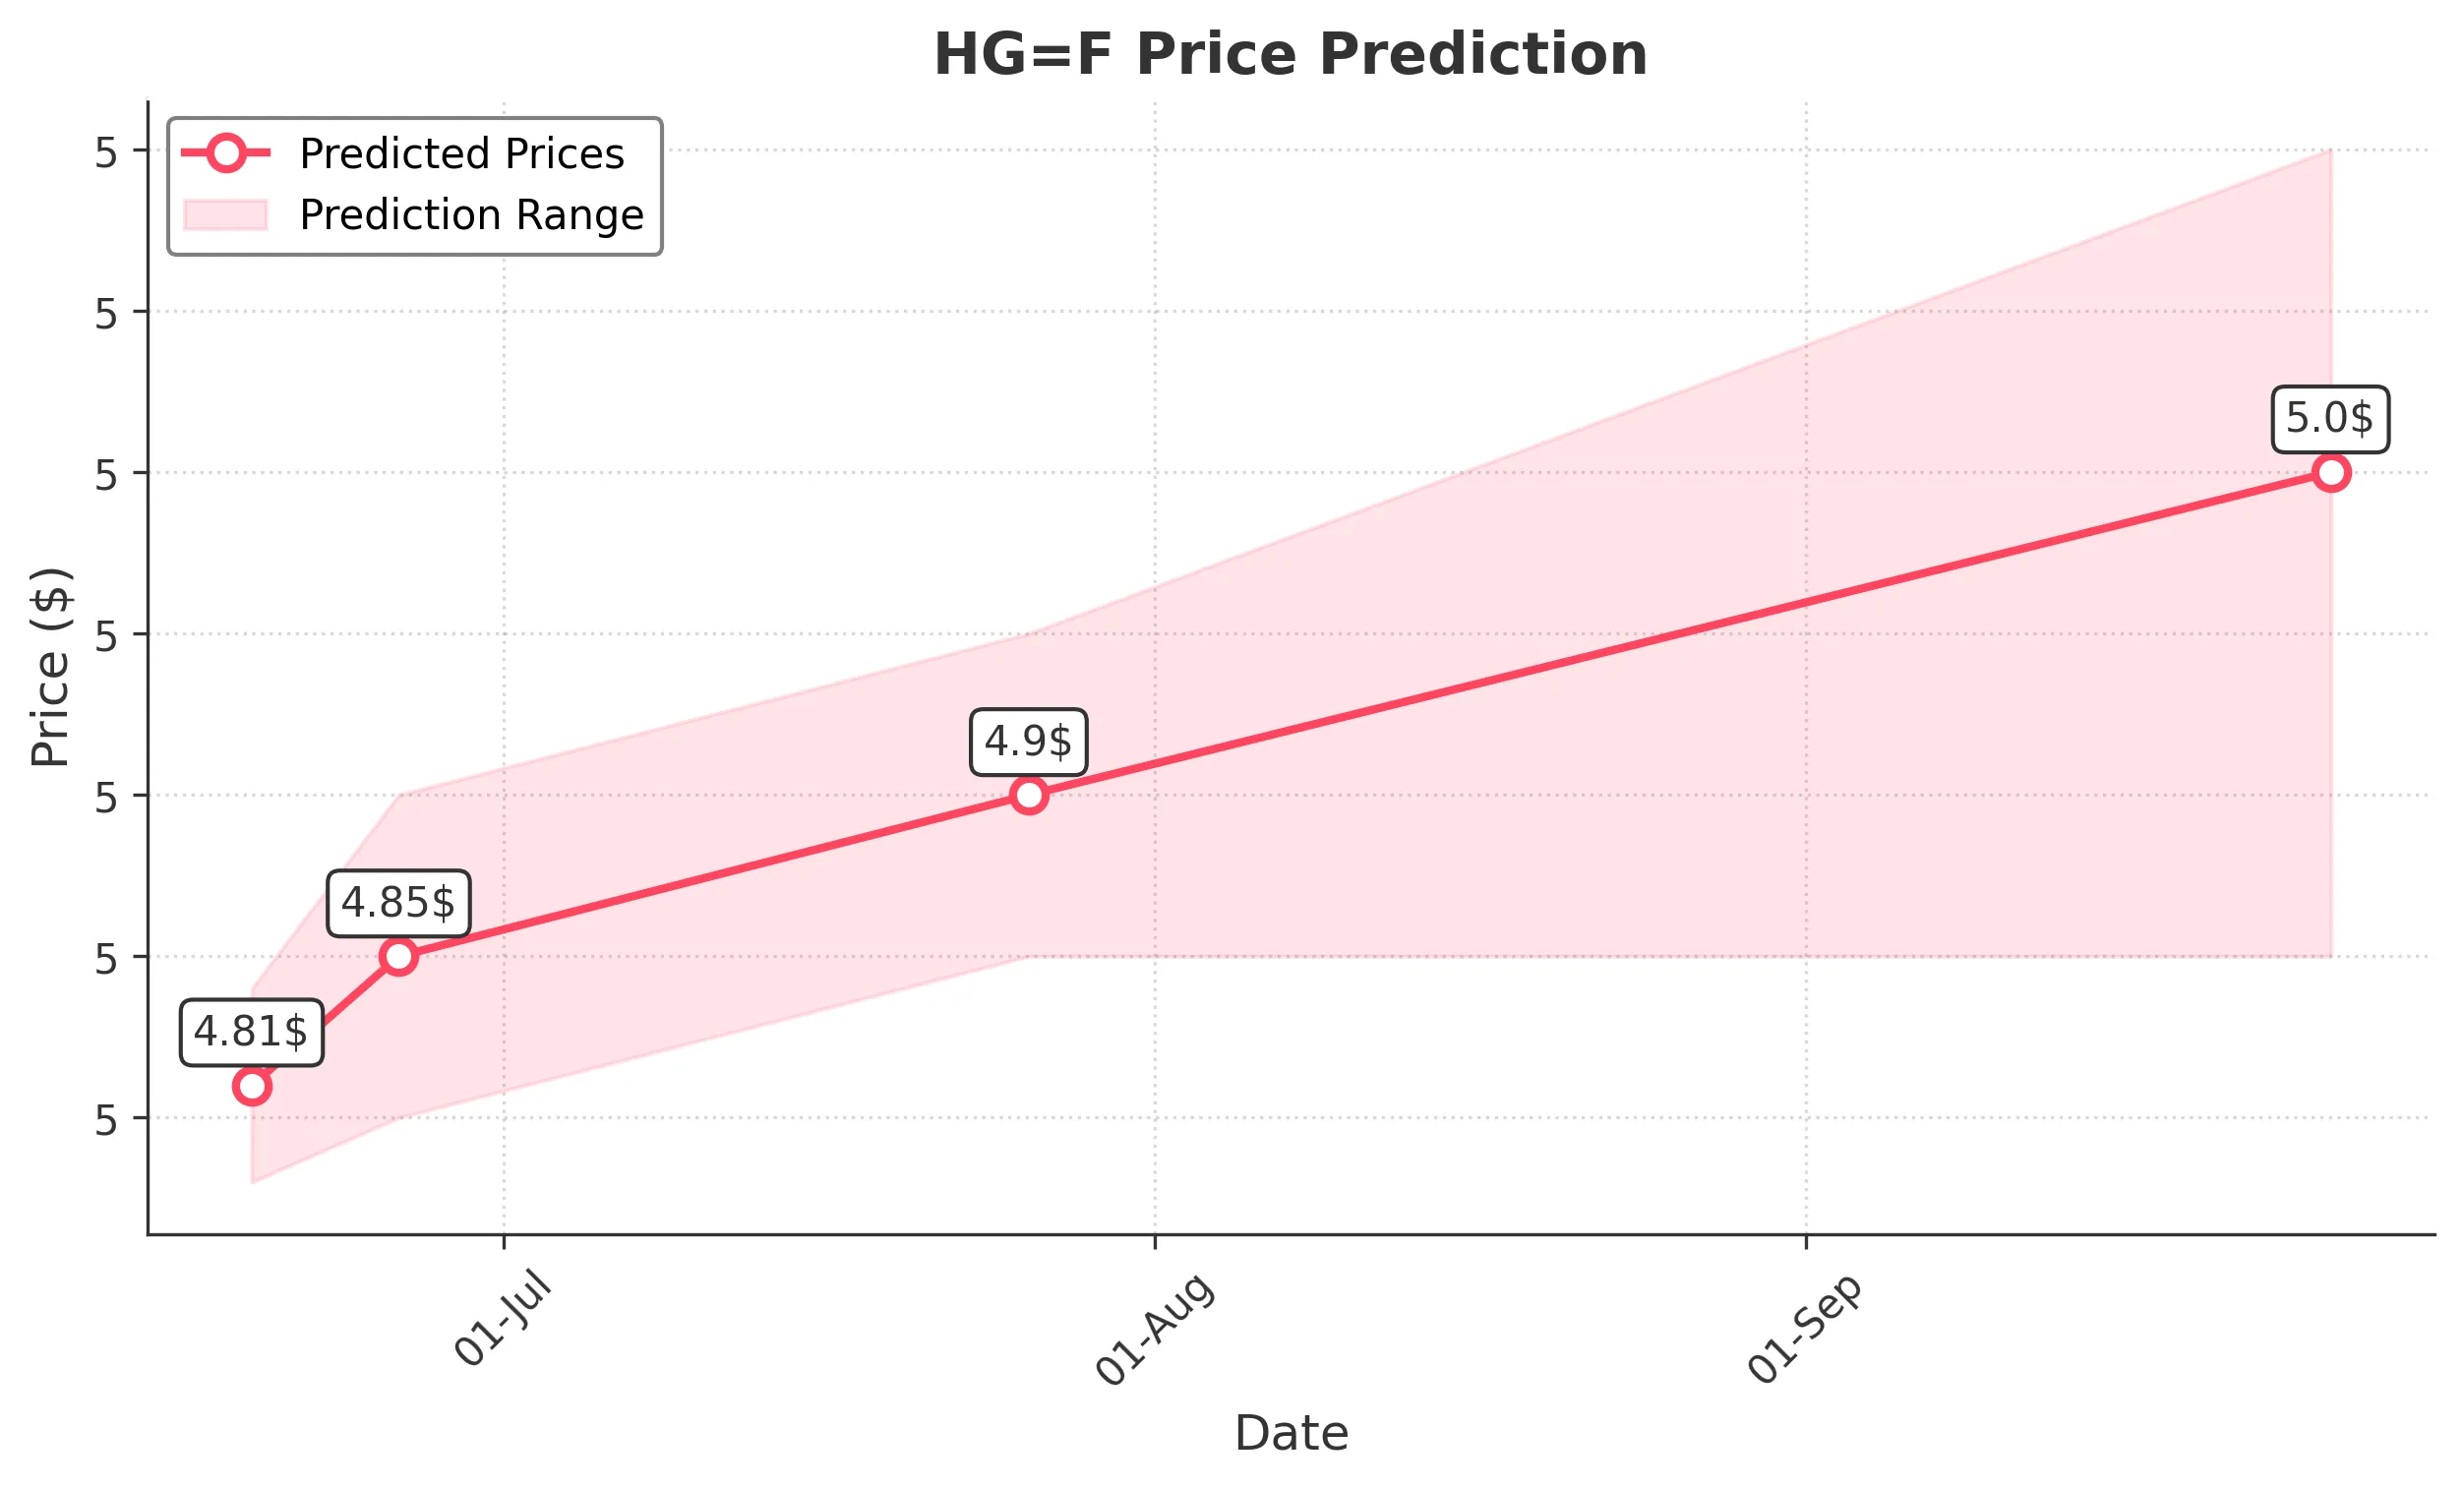
Target: June 19, 2025$4.81
$4.8
$4.84
$4.78
Description
The stock shows a slight bullish trend with a recent Doji candlestick indicating indecision. RSI is neutral, and MACD is close to crossing above the signal line, suggesting potential upward momentum. However, volatility remains a concern.
Analysis
Over the past 3 months, HG=F has shown a bearish trend with significant support around 4.80. Recent price action indicates a potential reversal, but the overall sentiment remains cautious. Volume has been inconsistent, and technical indicators suggest mixed signals.
Confidence Level
Potential Risks
Market sentiment could shift due to external factors, and a reversal is possible if selling pressure increases.
1 Week Prediction
Target: June 26, 2025$4.85
$4.83
$4.9
$4.8
Description
The stock is expected to continue its upward movement as it approaches resistance at 4.90. The MACD shows bullish divergence, and the RSI is nearing overbought territory, indicating potential for a pullback. Watch for volume spikes.
Analysis
The stock has been trading sideways with a slight bullish bias. Key resistance at 4.90 may limit upside potential. Technical indicators suggest a cautious approach, as the market sentiment remains mixed with external economic pressures.
Confidence Level
Potential Risks
If macroeconomic news is unfavorable, it could lead to a sudden drop in price despite the current bullish indicators.
1 Month Prediction
Target: July 26, 2025$4.9
$4.87
$4.95
$4.85
Description
The stock is likely to test the resistance level at 4.90, with potential for a breakout. The Bollinger Bands are tightening, indicating reduced volatility. However, the RSI suggests overbought conditions, which could lead to a pullback.
Analysis
The stock has shown a recovery from recent lows, but the overall trend remains uncertain. Key resistance levels are being tested, and while bullish signals are present, the potential for a correction exists. Volume patterns indicate cautious trading.
Confidence Level
Potential Risks
Market volatility and external economic factors could impact the stock's ability to maintain upward momentum.
3 Months Prediction
Target: September 26, 2025$5
$4.95
$5.1
$4.85
Description
The stock may reach 5.00 as it breaks through resistance levels. The MACD is bullish, and the RSI is stabilizing. However, external economic conditions could lead to volatility, impacting the price trajectory.
Analysis
The stock has shown signs of recovery, but the overall trend remains uncertain. Key resistance levels are being tested, and while bullish signals are present, the potential for a correction exists. Volume patterns indicate cautious trading.
Confidence Level
Potential Risks
Unforeseen macroeconomic events or changes in market sentiment could lead to significant price fluctuations.