HGF Trading Predictions
1 Day Prediction
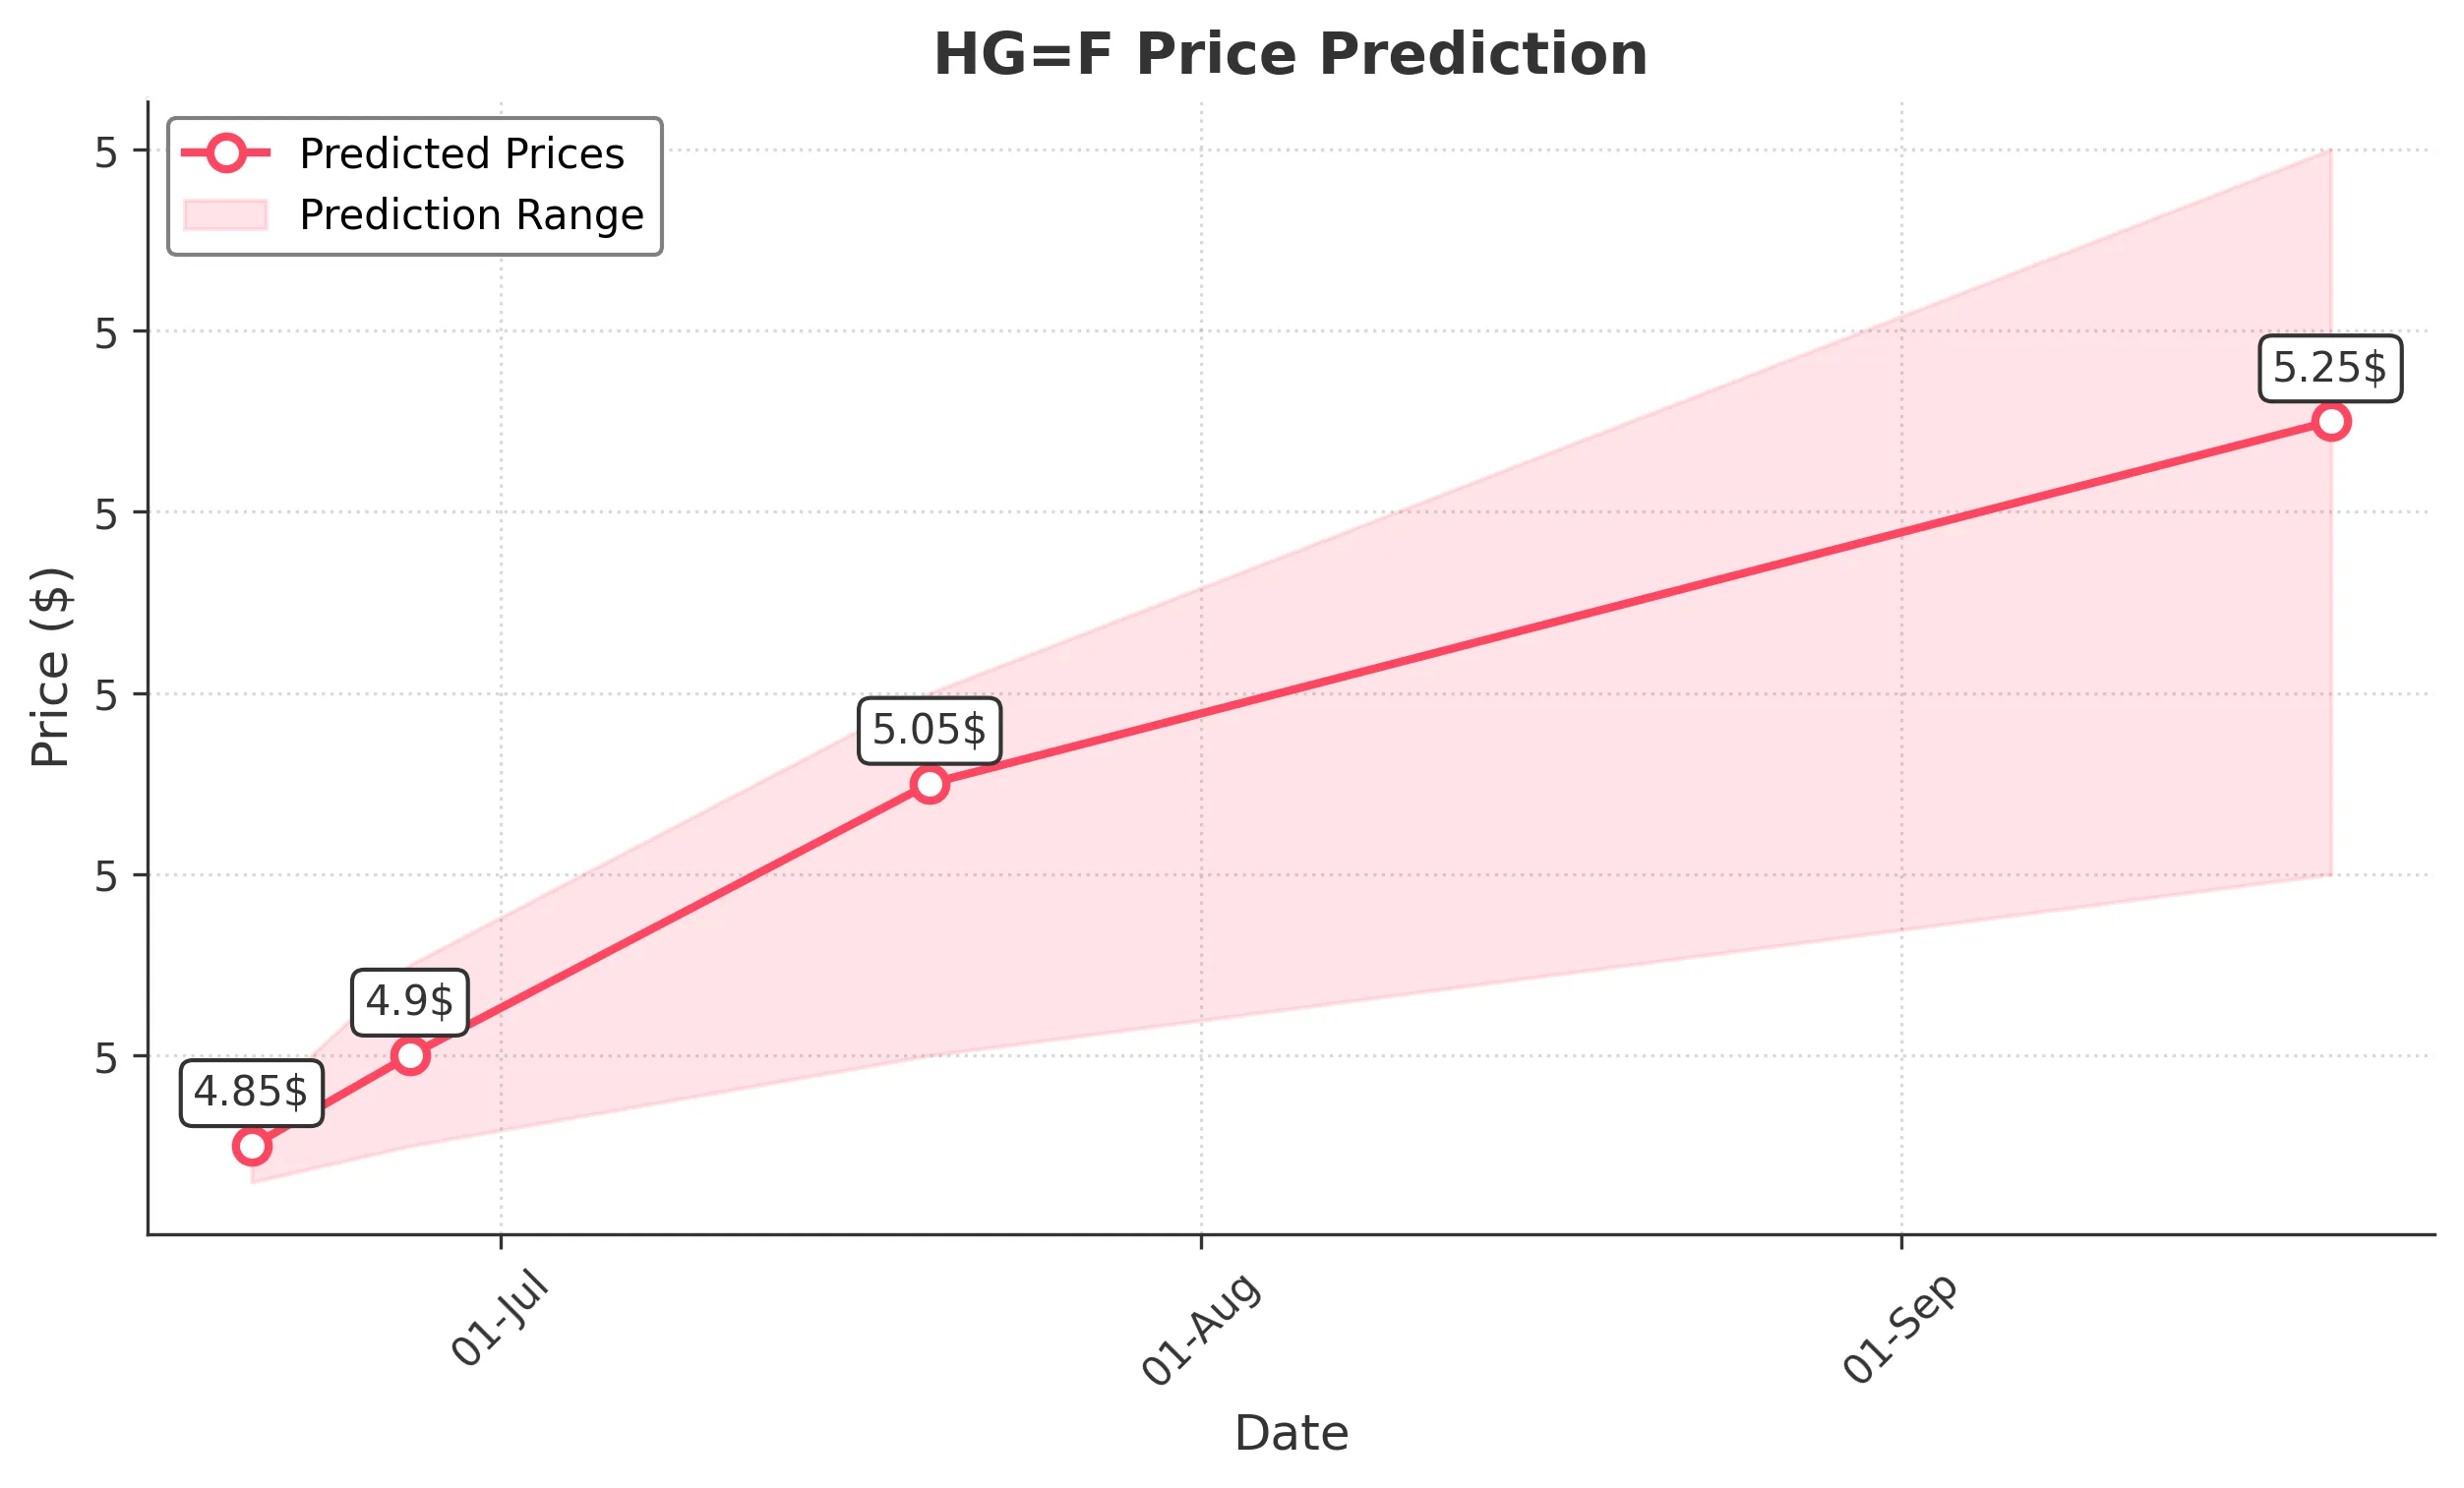
Target: June 20, 2025$4.85
$4.84
$4.87
$4.83
Description
The stock shows a slight bullish trend with a recent close above the 20-day moving average. RSI is neutral, indicating no overbought conditions. A small volume spike suggests potential upward momentum.
Analysis
Over the past 3 months, HG=F has shown a bearish trend with significant fluctuations. Key support at 4.80 and resistance at 5.00. Recent candlestick patterns indicate indecision, while volume has been inconsistent, suggesting uncertainty.
Confidence Level
Potential Risks
Market volatility and external news could impact the prediction. A reversal is possible if bearish sentiment emerges.
1 Week Prediction
Target: June 27, 2025$4.9
$4.87
$4.95
$4.85
Description
A potential bullish reversal is indicated by a recent hammer pattern. The MACD shows a bullish crossover, and the RSI is approaching oversold territory, suggesting upward momentum.
Analysis
The stock has been in a bearish phase but shows signs of recovery. Key resistance at 5.00 remains a challenge. Volume patterns indicate some accumulation, but overall market sentiment is mixed.
Confidence Level
Potential Risks
Unforeseen macroeconomic events or earnings reports could lead to volatility. The market sentiment remains cautious.
1 Month Prediction
Target: July 20, 2025$5.05
$4.95
$5.1
$4.9
Description
The stock may continue its upward trend as it approaches key Fibonacci retracement levels. The Bollinger Bands indicate potential for a breakout, and the MACD remains bullish.
Analysis
The past three months have shown a bearish trend, but recent indicators suggest a potential reversal. Key support at 4.80 and resistance at 5.00. Volume has been increasing, indicating growing interest.
Confidence Level
Potential Risks
Market corrections or negative news could reverse the trend. The overall economic environment remains uncertain.
3 Months Prediction
Target: September 20, 2025$5.25
$5.1
$5.4
$5
Description
If the bullish trend continues, the stock could reach higher levels. The RSI indicates potential for further gains, and the MACD remains positive. However, caution is advised due to market volatility.
Analysis
The stock has experienced significant volatility, with a bearish trend recently. Key resistance at 5.00 and support at 4.80. The overall market sentiment is cautious, and external factors could heavily influence future performance.
Confidence Level
Potential Risks
Long-term predictions are subject to significant uncertainty. Economic conditions and market sentiment could shift dramatically.