HGF Trading Predictions
1 Day Prediction
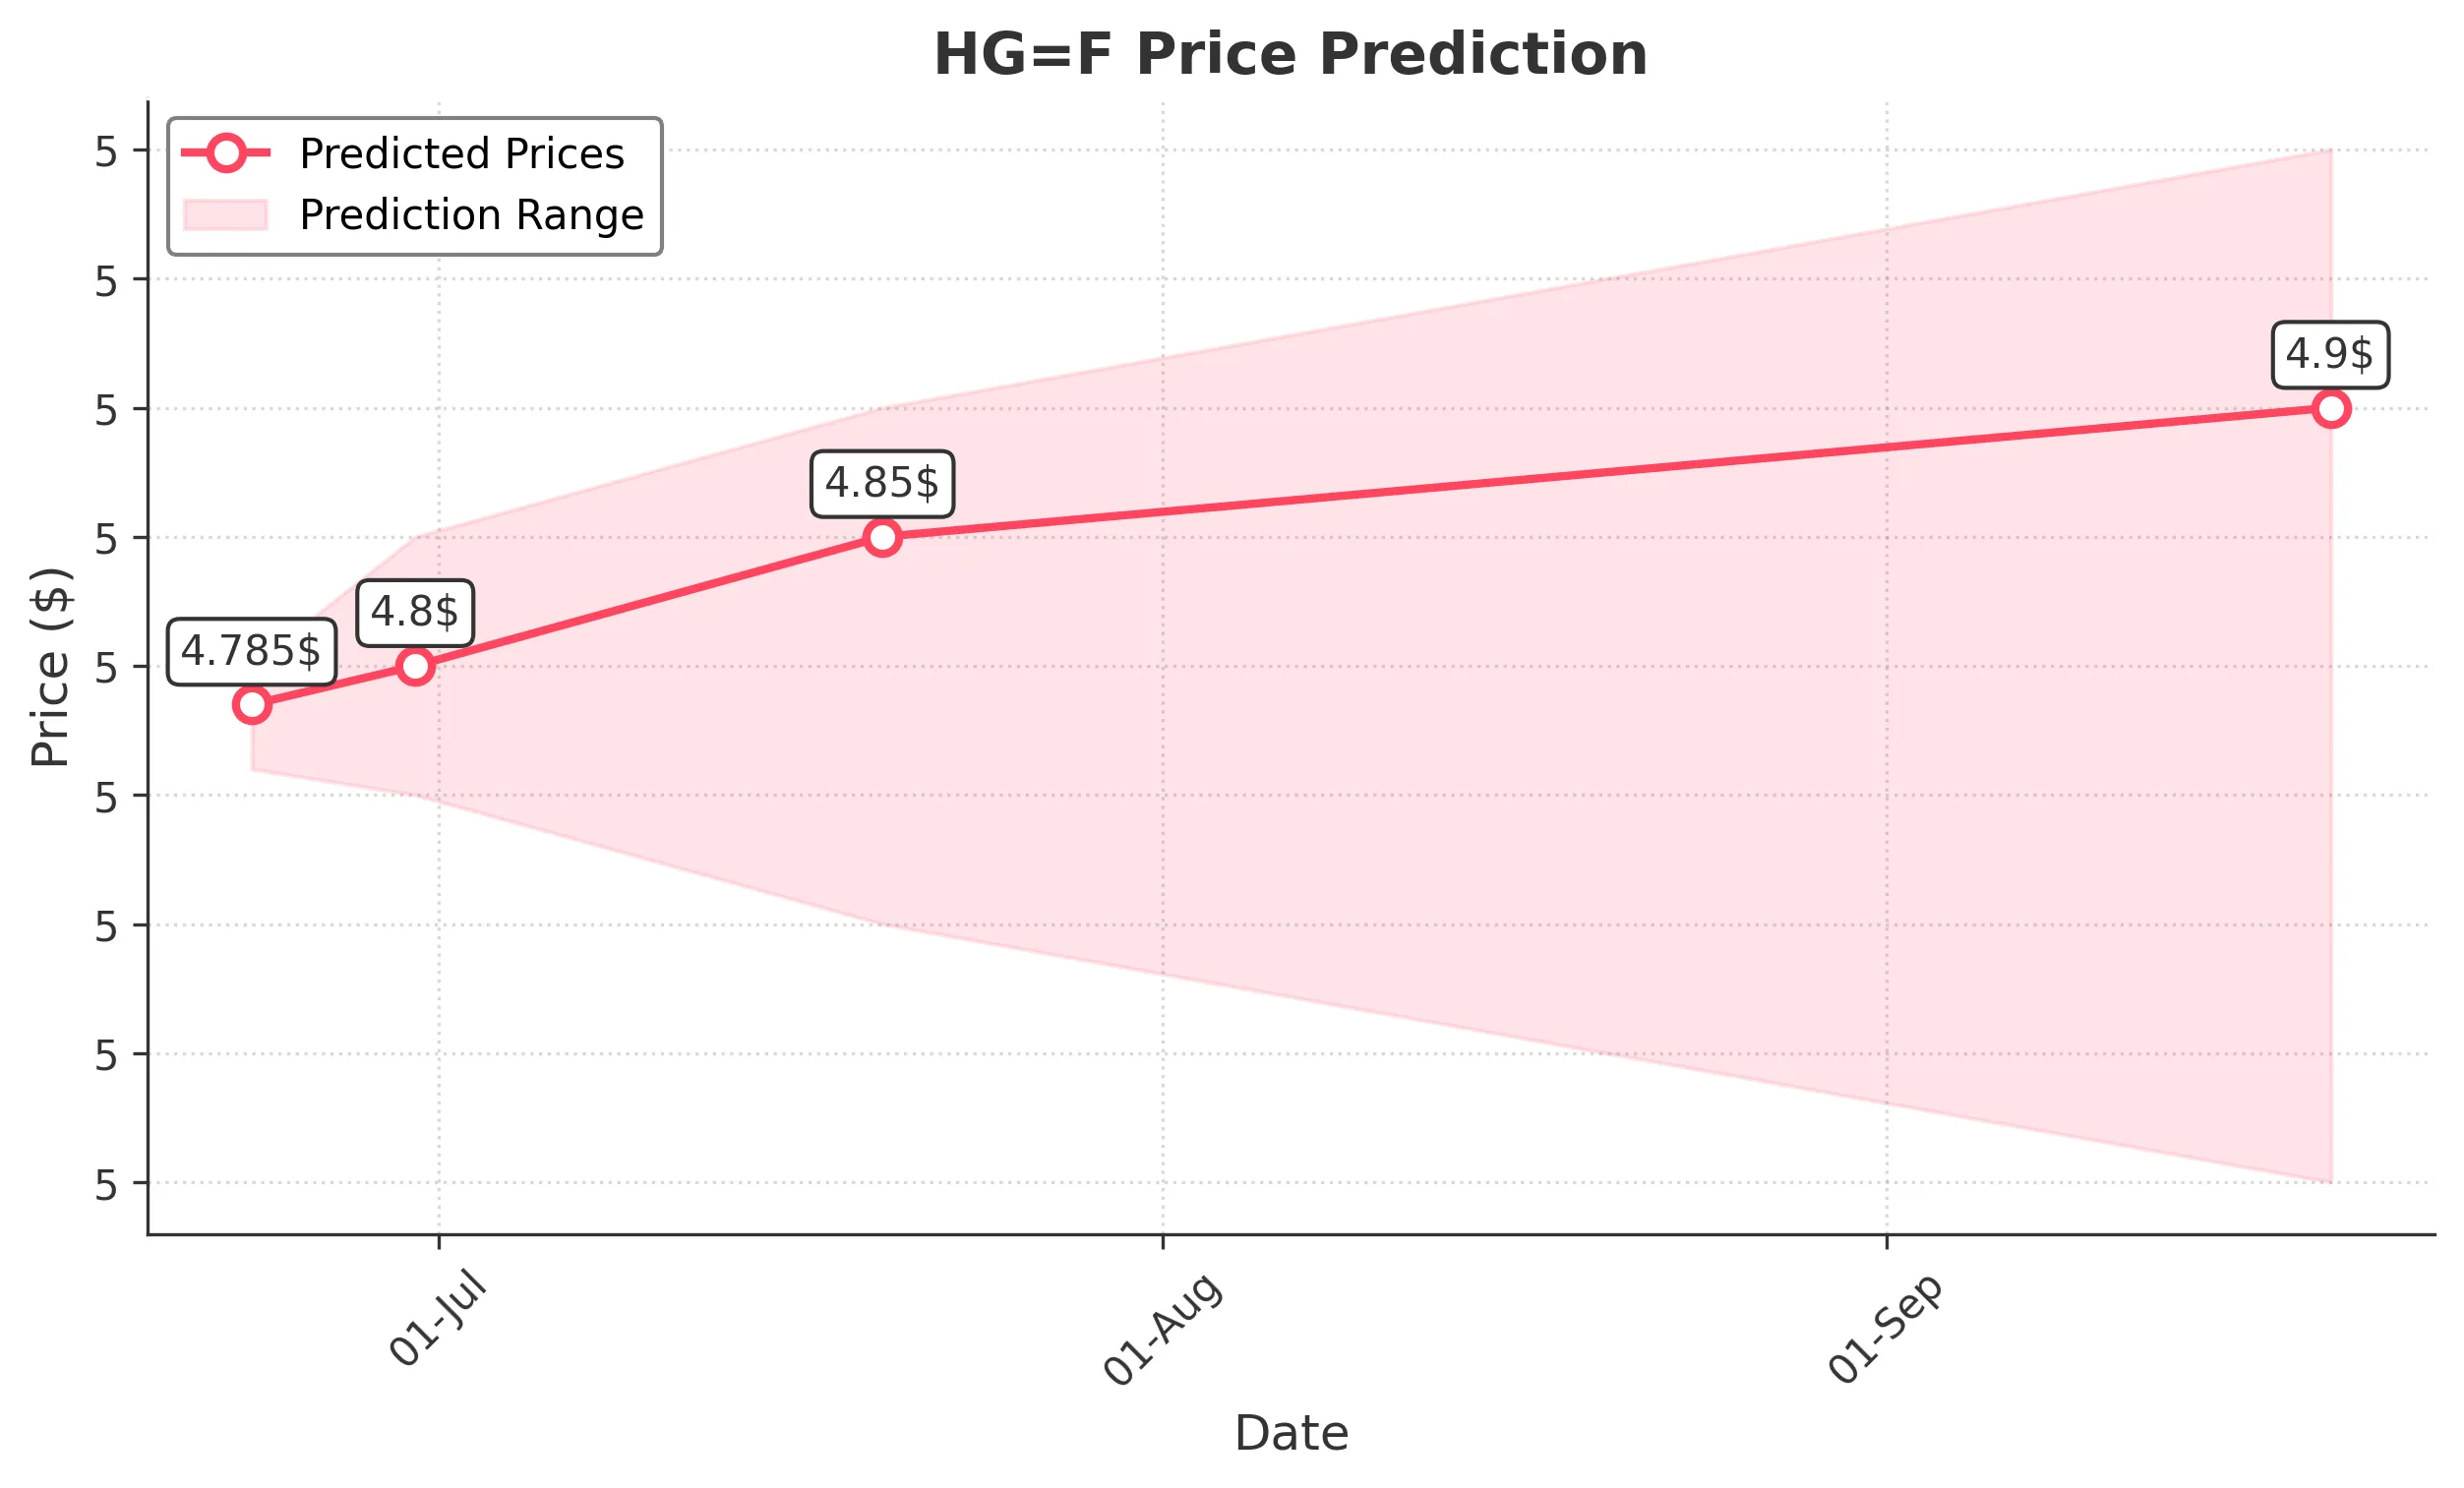
Target: June 23, 2025$4.785
$4.78
$4.8
$4.76
Description
The stock shows a slight bullish trend with a recent Doji candlestick indicating indecision. RSI is neutral, and MACD is close to crossing above the signal line, suggesting potential upward momentum. However, recent volatility may limit gains.
Analysis
Over the past 3 months, HG=F has shown a bearish trend with significant support around 4.60. Recent price action indicates a potential reversal, but the overall sentiment remains cautious. Volume spikes on down days suggest selling pressure.
Confidence Level
Potential Risks
Market sentiment could shift due to external factors, and a bearish reversal is possible if selling pressure increases.
1 Week Prediction
Target: June 30, 2025$4.8
$4.785
$4.85
$4.75
Description
The stock is expected to stabilize around 4.80 as it approaches resistance levels. The MACD shows a bullish divergence, and the RSI is nearing overbought territory, indicating potential upward movement but with caution.
Analysis
The stock has been fluctuating within a range, with resistance at 4.85. Technical indicators suggest a possible upward trend, but the overall market sentiment remains mixed, with external factors influencing price movements.
Confidence Level
Potential Risks
Potential market corrections or negative news could impact the stock's performance, leading to a possible decline.
1 Month Prediction
Target: July 20, 2025$4.85
$4.8
$4.9
$4.7
Description
The stock is likely to test the upper resistance at 4.90. The Bollinger Bands indicate tightening, suggesting a breakout may occur. However, the RSI indicates overbought conditions, which could lead to a pullback.
Analysis
The stock has shown signs of recovery but remains below key resistance levels. Volume analysis indicates a lack of strong buying interest, and external economic factors could influence future performance.
Confidence Level
Potential Risks
Market volatility and economic indicators could lead to unexpected price movements, affecting the prediction.
3 Months Prediction
Target: September 20, 2025$4.9
$4.85
$5
$4.6
Description
The stock may reach 4.90 as it approaches a critical resistance level. The MACD indicates a bullish trend, but the RSI suggests potential overbought conditions. A correction could occur if market sentiment shifts.
Analysis
The stock has been in a bearish trend but shows signs of recovery. Key resistance at 5.00 may limit upward movement. Technical indicators suggest caution, and external factors could heavily influence future price action.
Confidence Level
Potential Risks
Unforeseen macroeconomic events or changes in market sentiment could lead to significant price fluctuations.