HGF Trading Predictions
1 Day Prediction
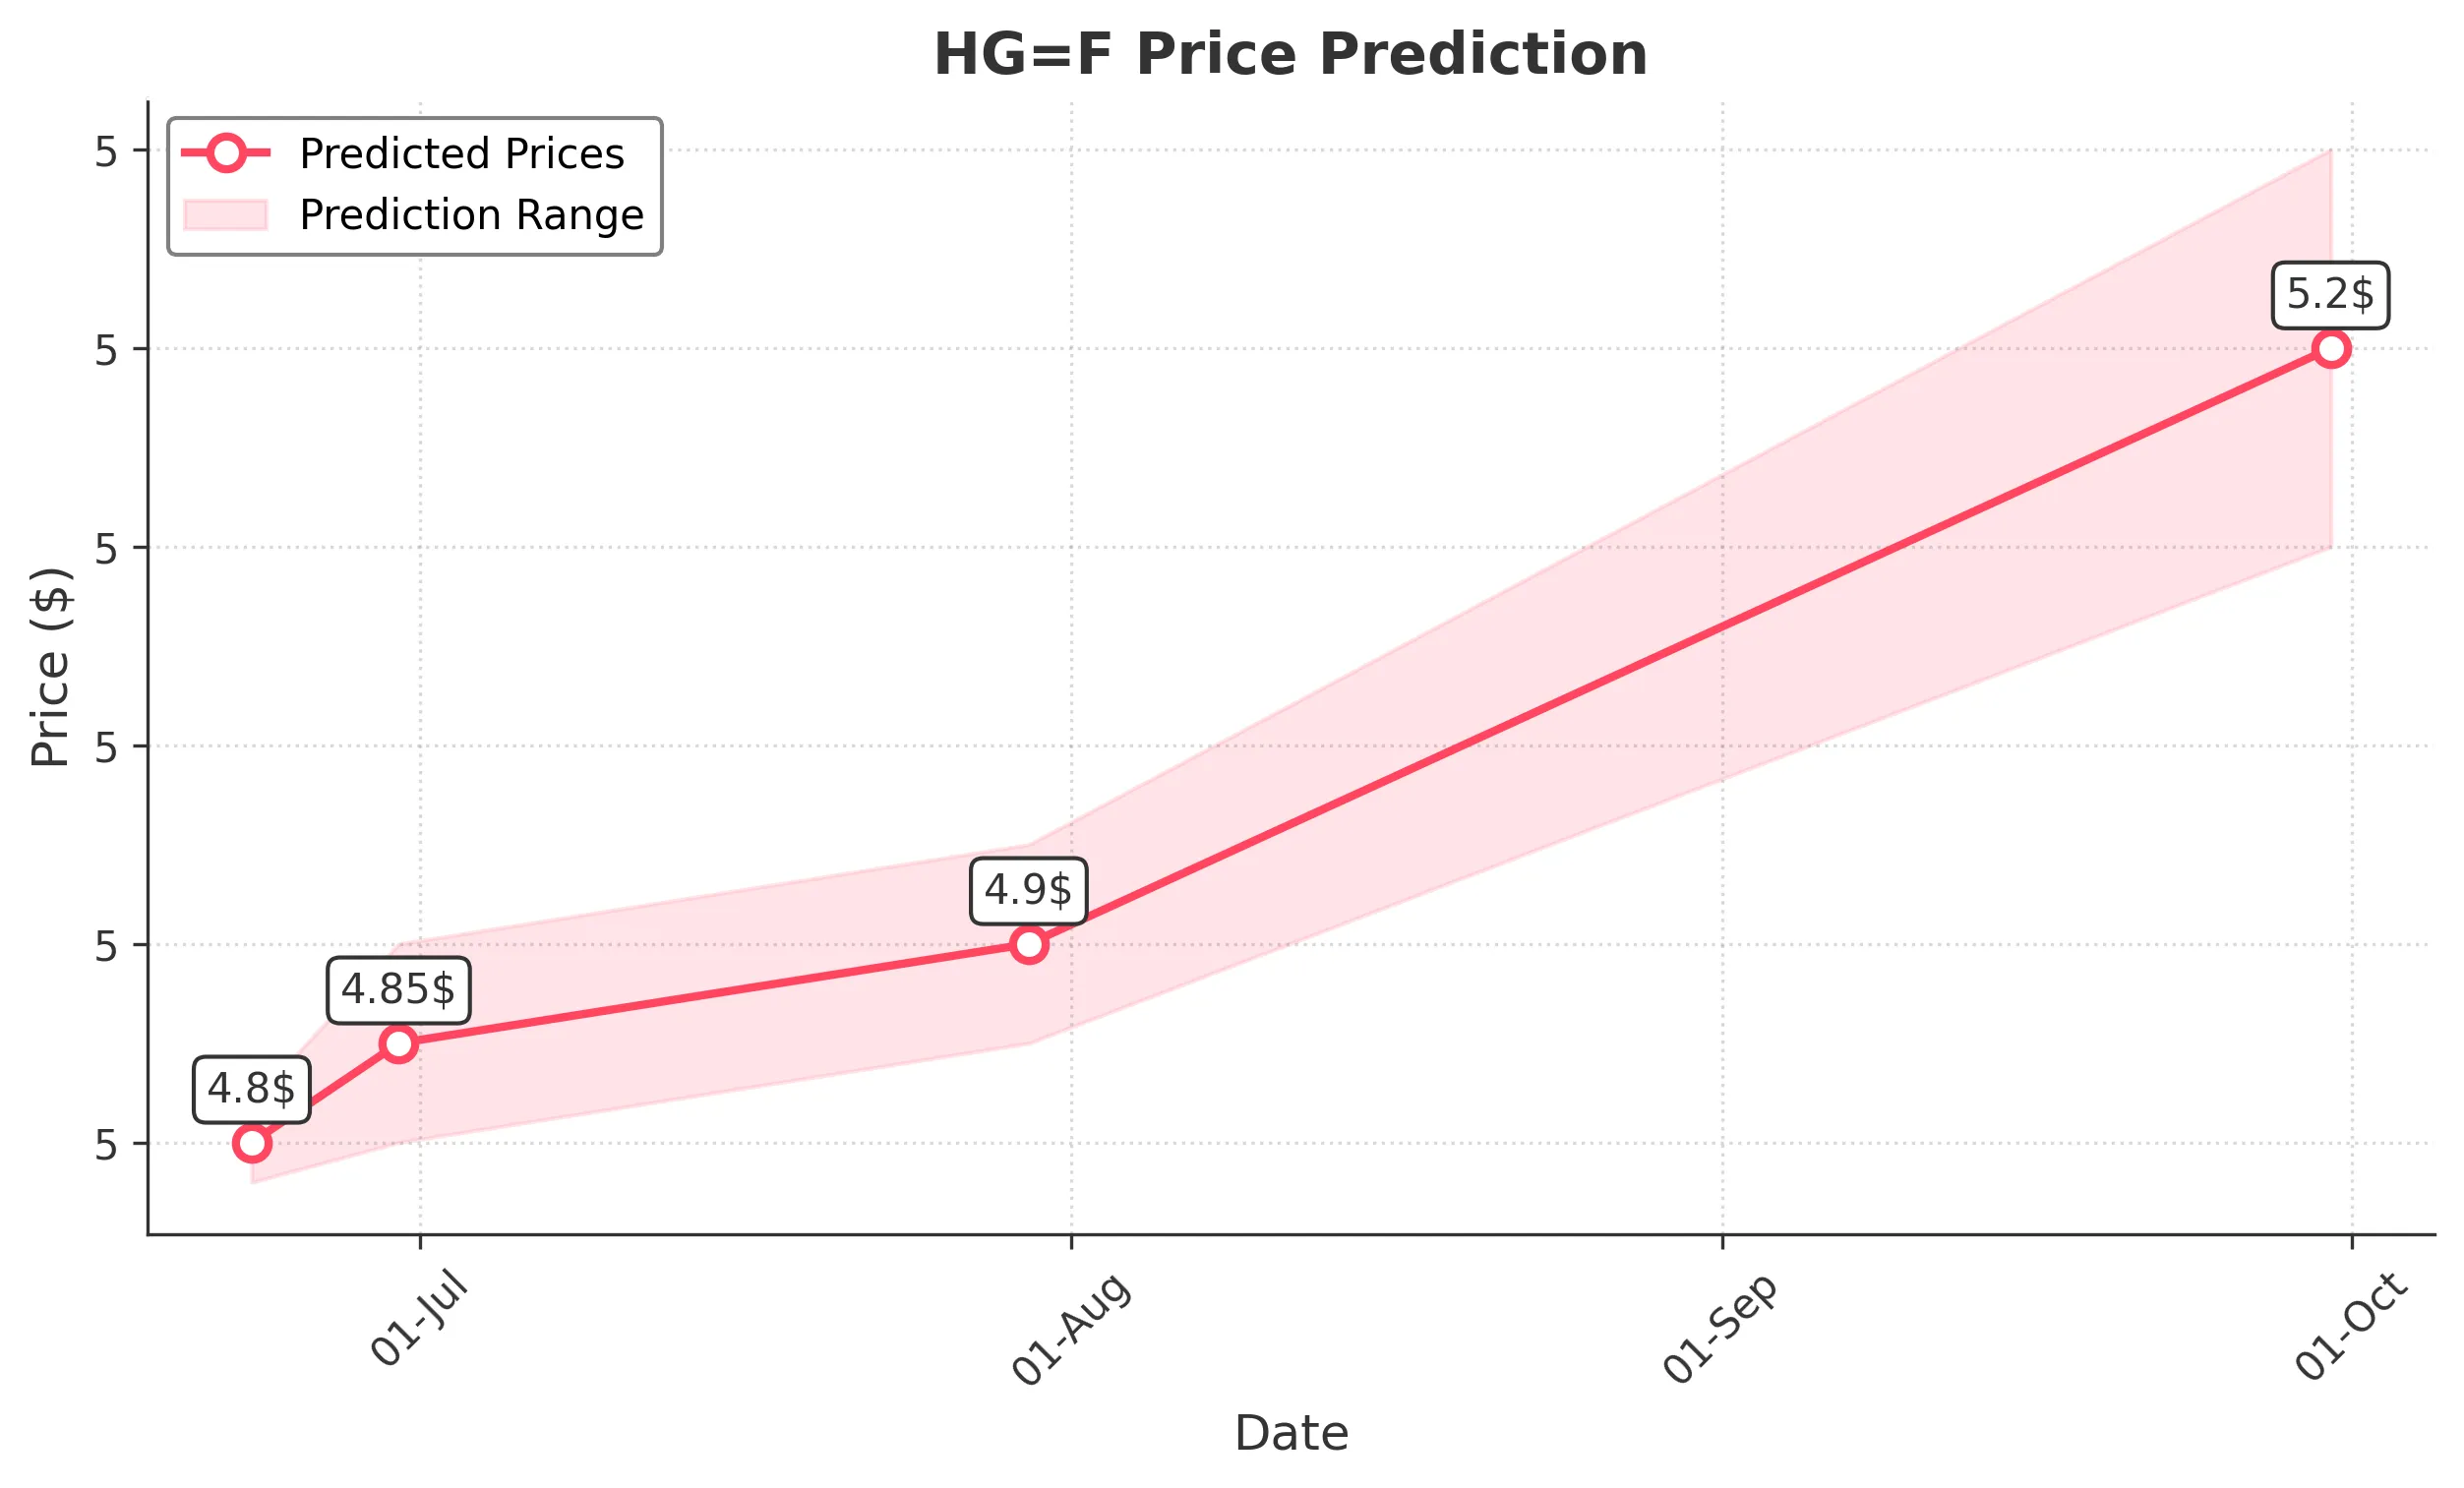
Target: June 23, 2025$4.8
$4.79
$4.82
$4.78
Description
The stock shows a slight bullish trend with a recent Doji candlestick indicating indecision. The RSI is neutral, and MACD is close to crossing above the signal line, suggesting potential upward movement. However, recent low volume raises caution.
Analysis
Over the past 3 months, HG=F has shown a bearish trend with significant support around 4.70. The recent price action indicates a potential reversal, but the overall sentiment remains cautious. Technical indicators like RSI and MACD suggest indecision, while volume patterns indicate lower interest.
Confidence Level
Potential Risks
Low trading volume may lead to volatility. Market sentiment could shift based on external news.
1 Week Prediction
Target: June 30, 2025$4.85
$4.82
$4.9
$4.8
Description
The stock may see a slight recovery as it approaches resistance at 4.90. The Bollinger Bands are tightening, indicating potential volatility. A bullish engulfing pattern was observed recently, suggesting upward momentum.
Analysis
The stock has been in a bearish phase but shows signs of recovery. Key resistance at 4.90 may limit upward movement. Technical indicators are mixed, with some bullish signals, but overall market sentiment remains cautious due to macroeconomic uncertainties.
Confidence Level
Potential Risks
Resistance levels may hold back price increases. Market conditions and external factors could impact performance.
1 Month Prediction
Target: July 30, 2025$4.9
$4.87
$4.95
$4.85
Description
A potential bullish trend may develop as the stock approaches key Fibonacci retracement levels. The MACD shows signs of bullish divergence, and the RSI is moving towards overbought territory, indicating upward momentum.
Analysis
The stock has shown a mixed performance with a recent shift towards bullish sentiment. Key support at 4.70 and resistance at 4.90 are critical levels. Technical indicators suggest a potential upward trend, but external factors could introduce volatility.
Confidence Level
Potential Risks
Market volatility and external economic factors could disrupt the predicted trend. Watch for any significant news.
3 Months Prediction
Target: September 30, 2025$5.2
$5.15
$5.3
$5.1
Description
If the bullish trend continues, the stock could reach 5.20, supported by positive market sentiment and potential macroeconomic recovery. The RSI may indicate overbought conditions, suggesting caution.
Analysis
The stock's performance over the last three months has been bearish, but recent indicators suggest a possible recovery. Key resistance levels will be crucial in determining future price action. The overall market sentiment remains mixed, with external economic factors likely influencing performance.
Confidence Level
Potential Risks
Long-term predictions are uncertain due to potential market corrections and economic shifts. Watch for changes in market sentiment.