HGF Trading Predictions
1 Day Prediction
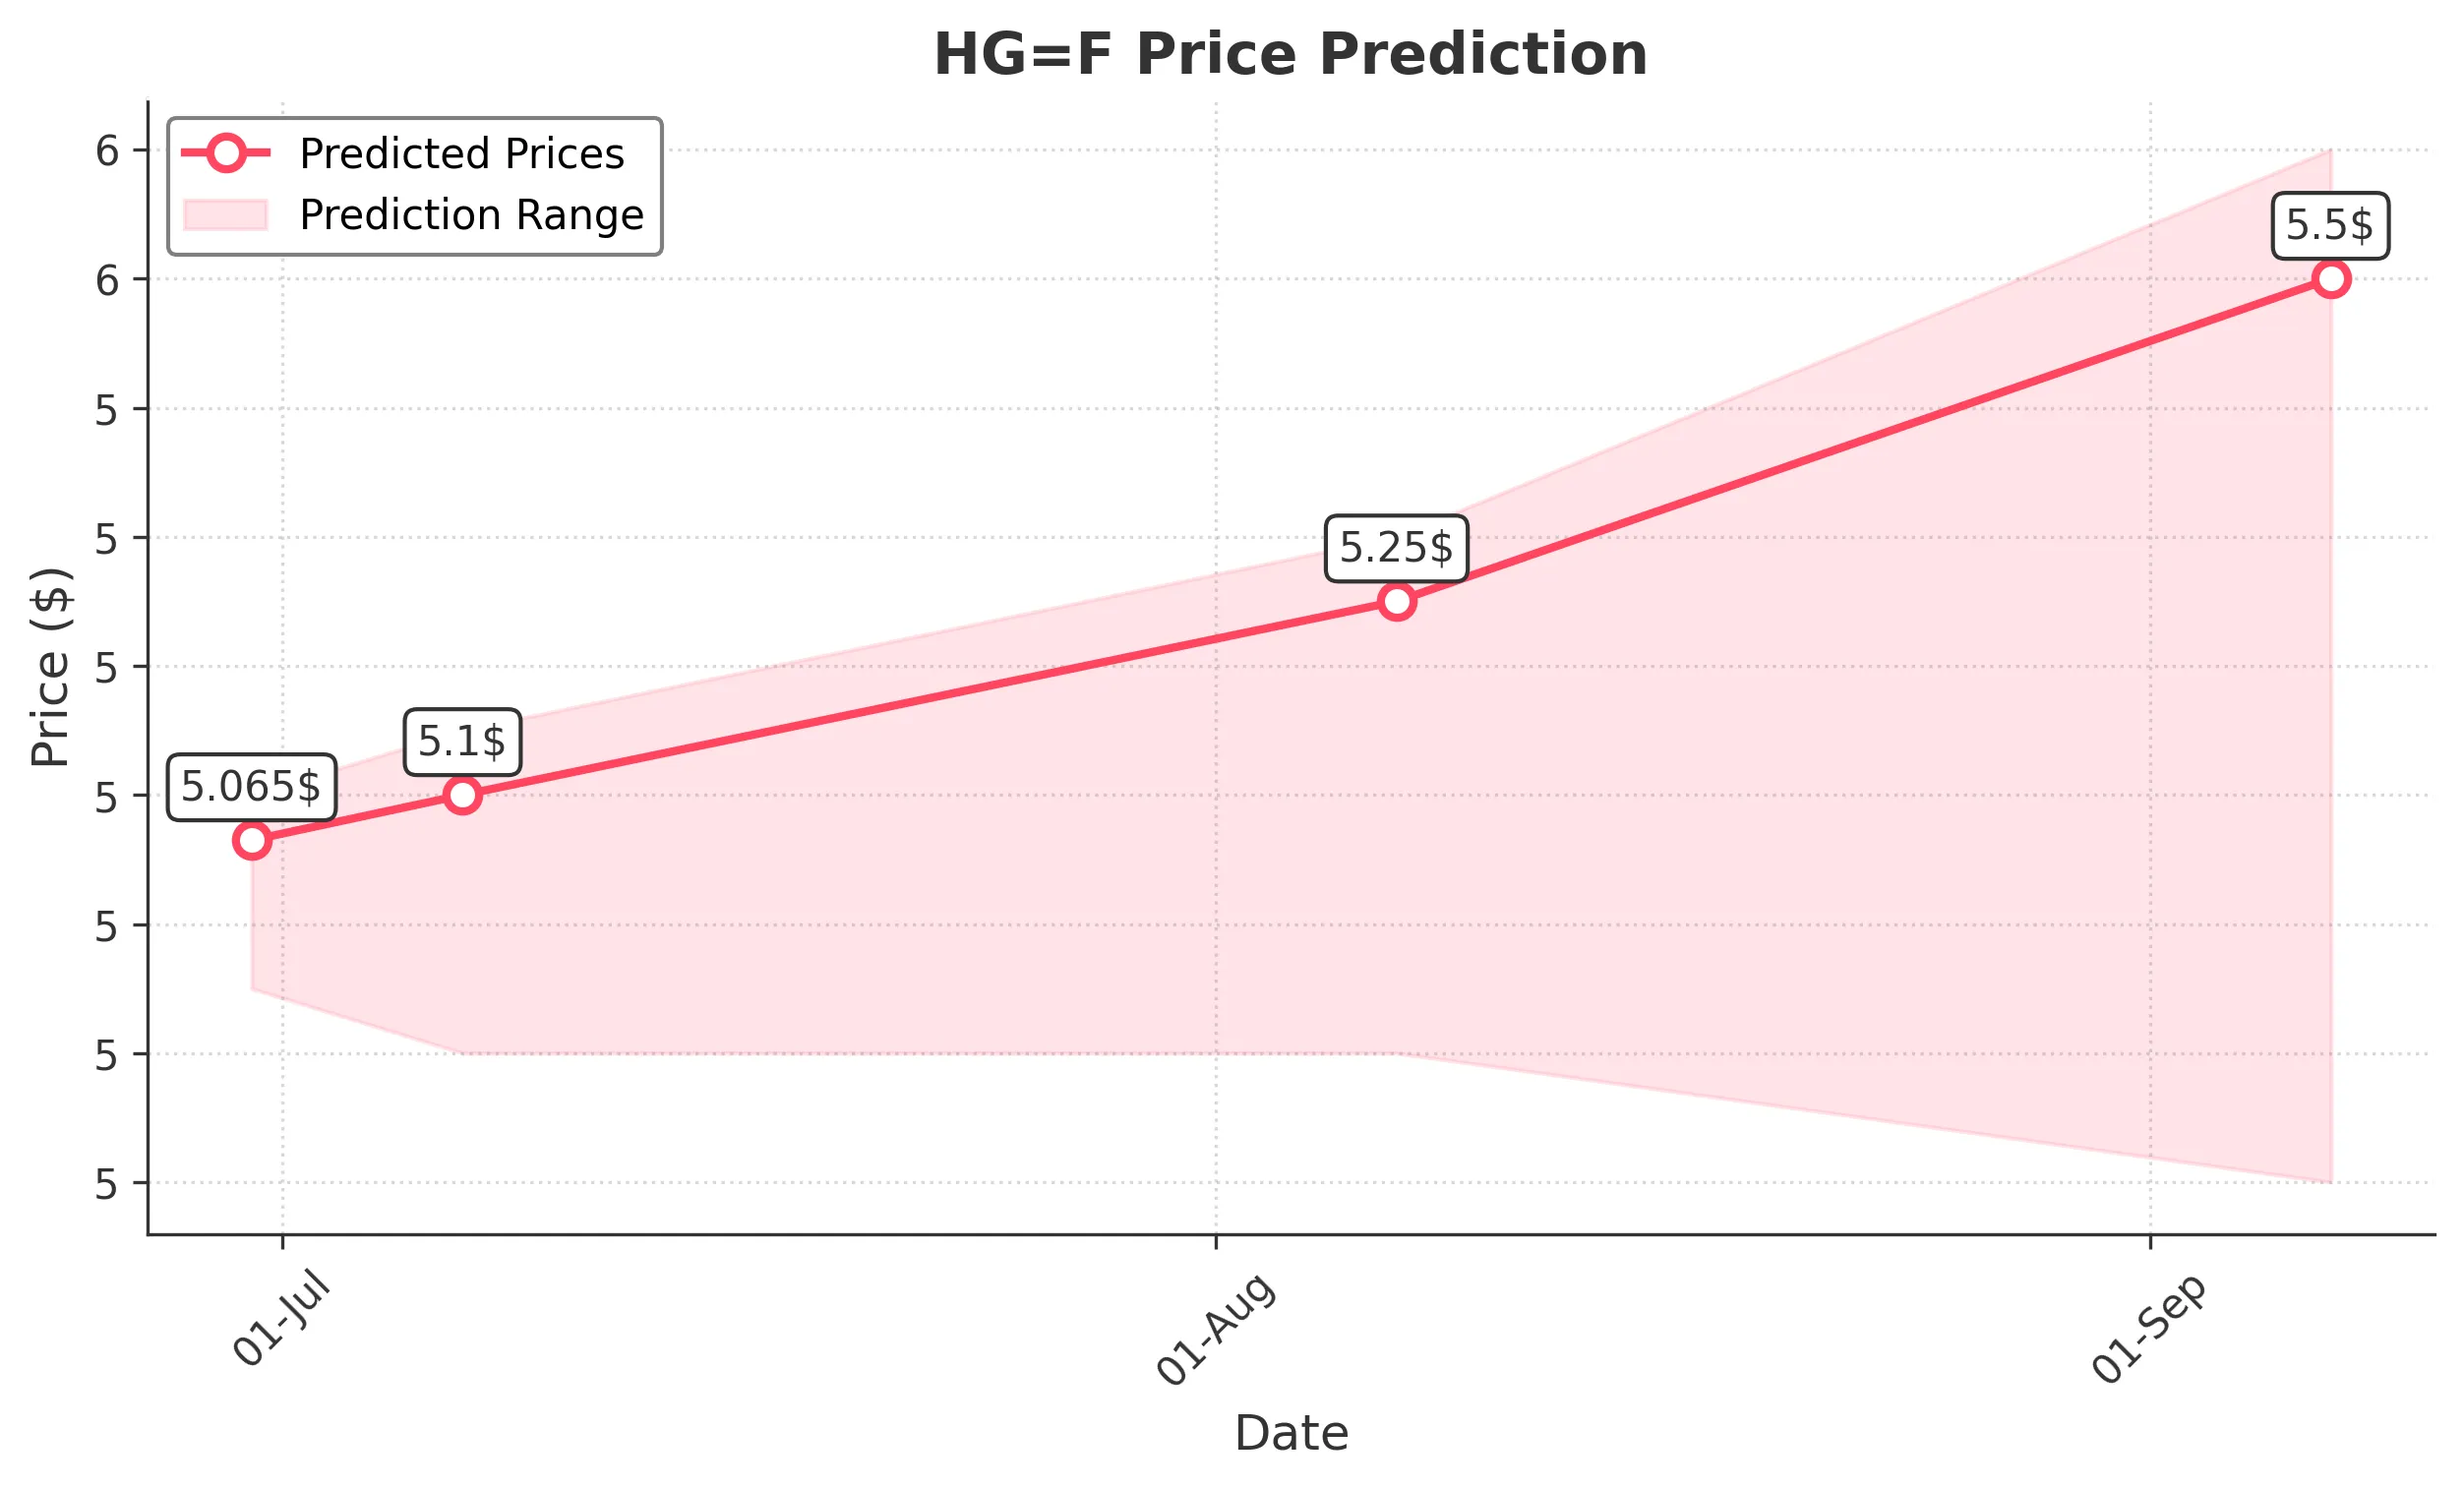
Target: June 30, 2025$5.065
$5.05
$5.1
$4.95
Description
The stock shows a slight bullish trend with recent higher lows. The RSI is approaching overbought levels, indicating potential consolidation. A Doji pattern suggests indecision, but overall sentiment remains positive.
Analysis
Over the past 3 months, HG=F has shown a bullish trend with significant support around 4.80. The recent price action indicates a potential upward movement, but the RSI nearing overbought levels and recent Doji patterns suggest caution.
Confidence Level
Potential Risks
Market volatility and external news could impact the price. A reversal is possible if bearish sentiment increases.
1 Week Prediction
Target: July 7, 2025$5.1
$5.065
$5.15
$4.9
Description
The stock is expected to maintain its upward momentum, supported by recent bullish candlestick patterns. However, the MACD shows signs of potential divergence, indicating a possible pullback.
Analysis
The stock has been trending upward, with resistance at 5.15. Volume has been stable, but the MACD divergence raises concerns about sustainability. Overall, the sentiment remains cautiously optimistic.
Confidence Level
Potential Risks
Potential market corrections and external economic factors could lead to unexpected price movements.
1 Month Prediction
Target: August 7, 2025$5.25
$5.1
$5.3
$4.9
Description
A bullish outlook is supported by the upward trend and positive market sentiment. However, the RSI indicates overbought conditions, suggesting a potential pullback before reaching the target.
Analysis
The stock has shown resilience with a bullish trend, but the RSI indicates potential overbought conditions. Key resistance at 5.30 may limit upside potential, while support remains at 4.90.
Confidence Level
Potential Risks
Market corrections and geopolitical events could significantly impact the stock's performance.
3 Months Prediction
Target: September 7, 2025$5.5
$5.25
$5.6
$4.8
Description
Long-term bullish sentiment is supported by strong fundamentals and technical indicators. However, potential market corrections and economic uncertainties could lead to volatility.
Analysis
The stock has shown a strong upward trend, but external economic factors and market sentiment could introduce volatility. Key support at 4.80 and resistance at 5.60 will be critical in the coming months.
Confidence Level
Potential Risks
Economic downturns or unexpected news could reverse the bullish trend, leading to significant price fluctuations.