HGF Trading Predictions
1 Day Prediction
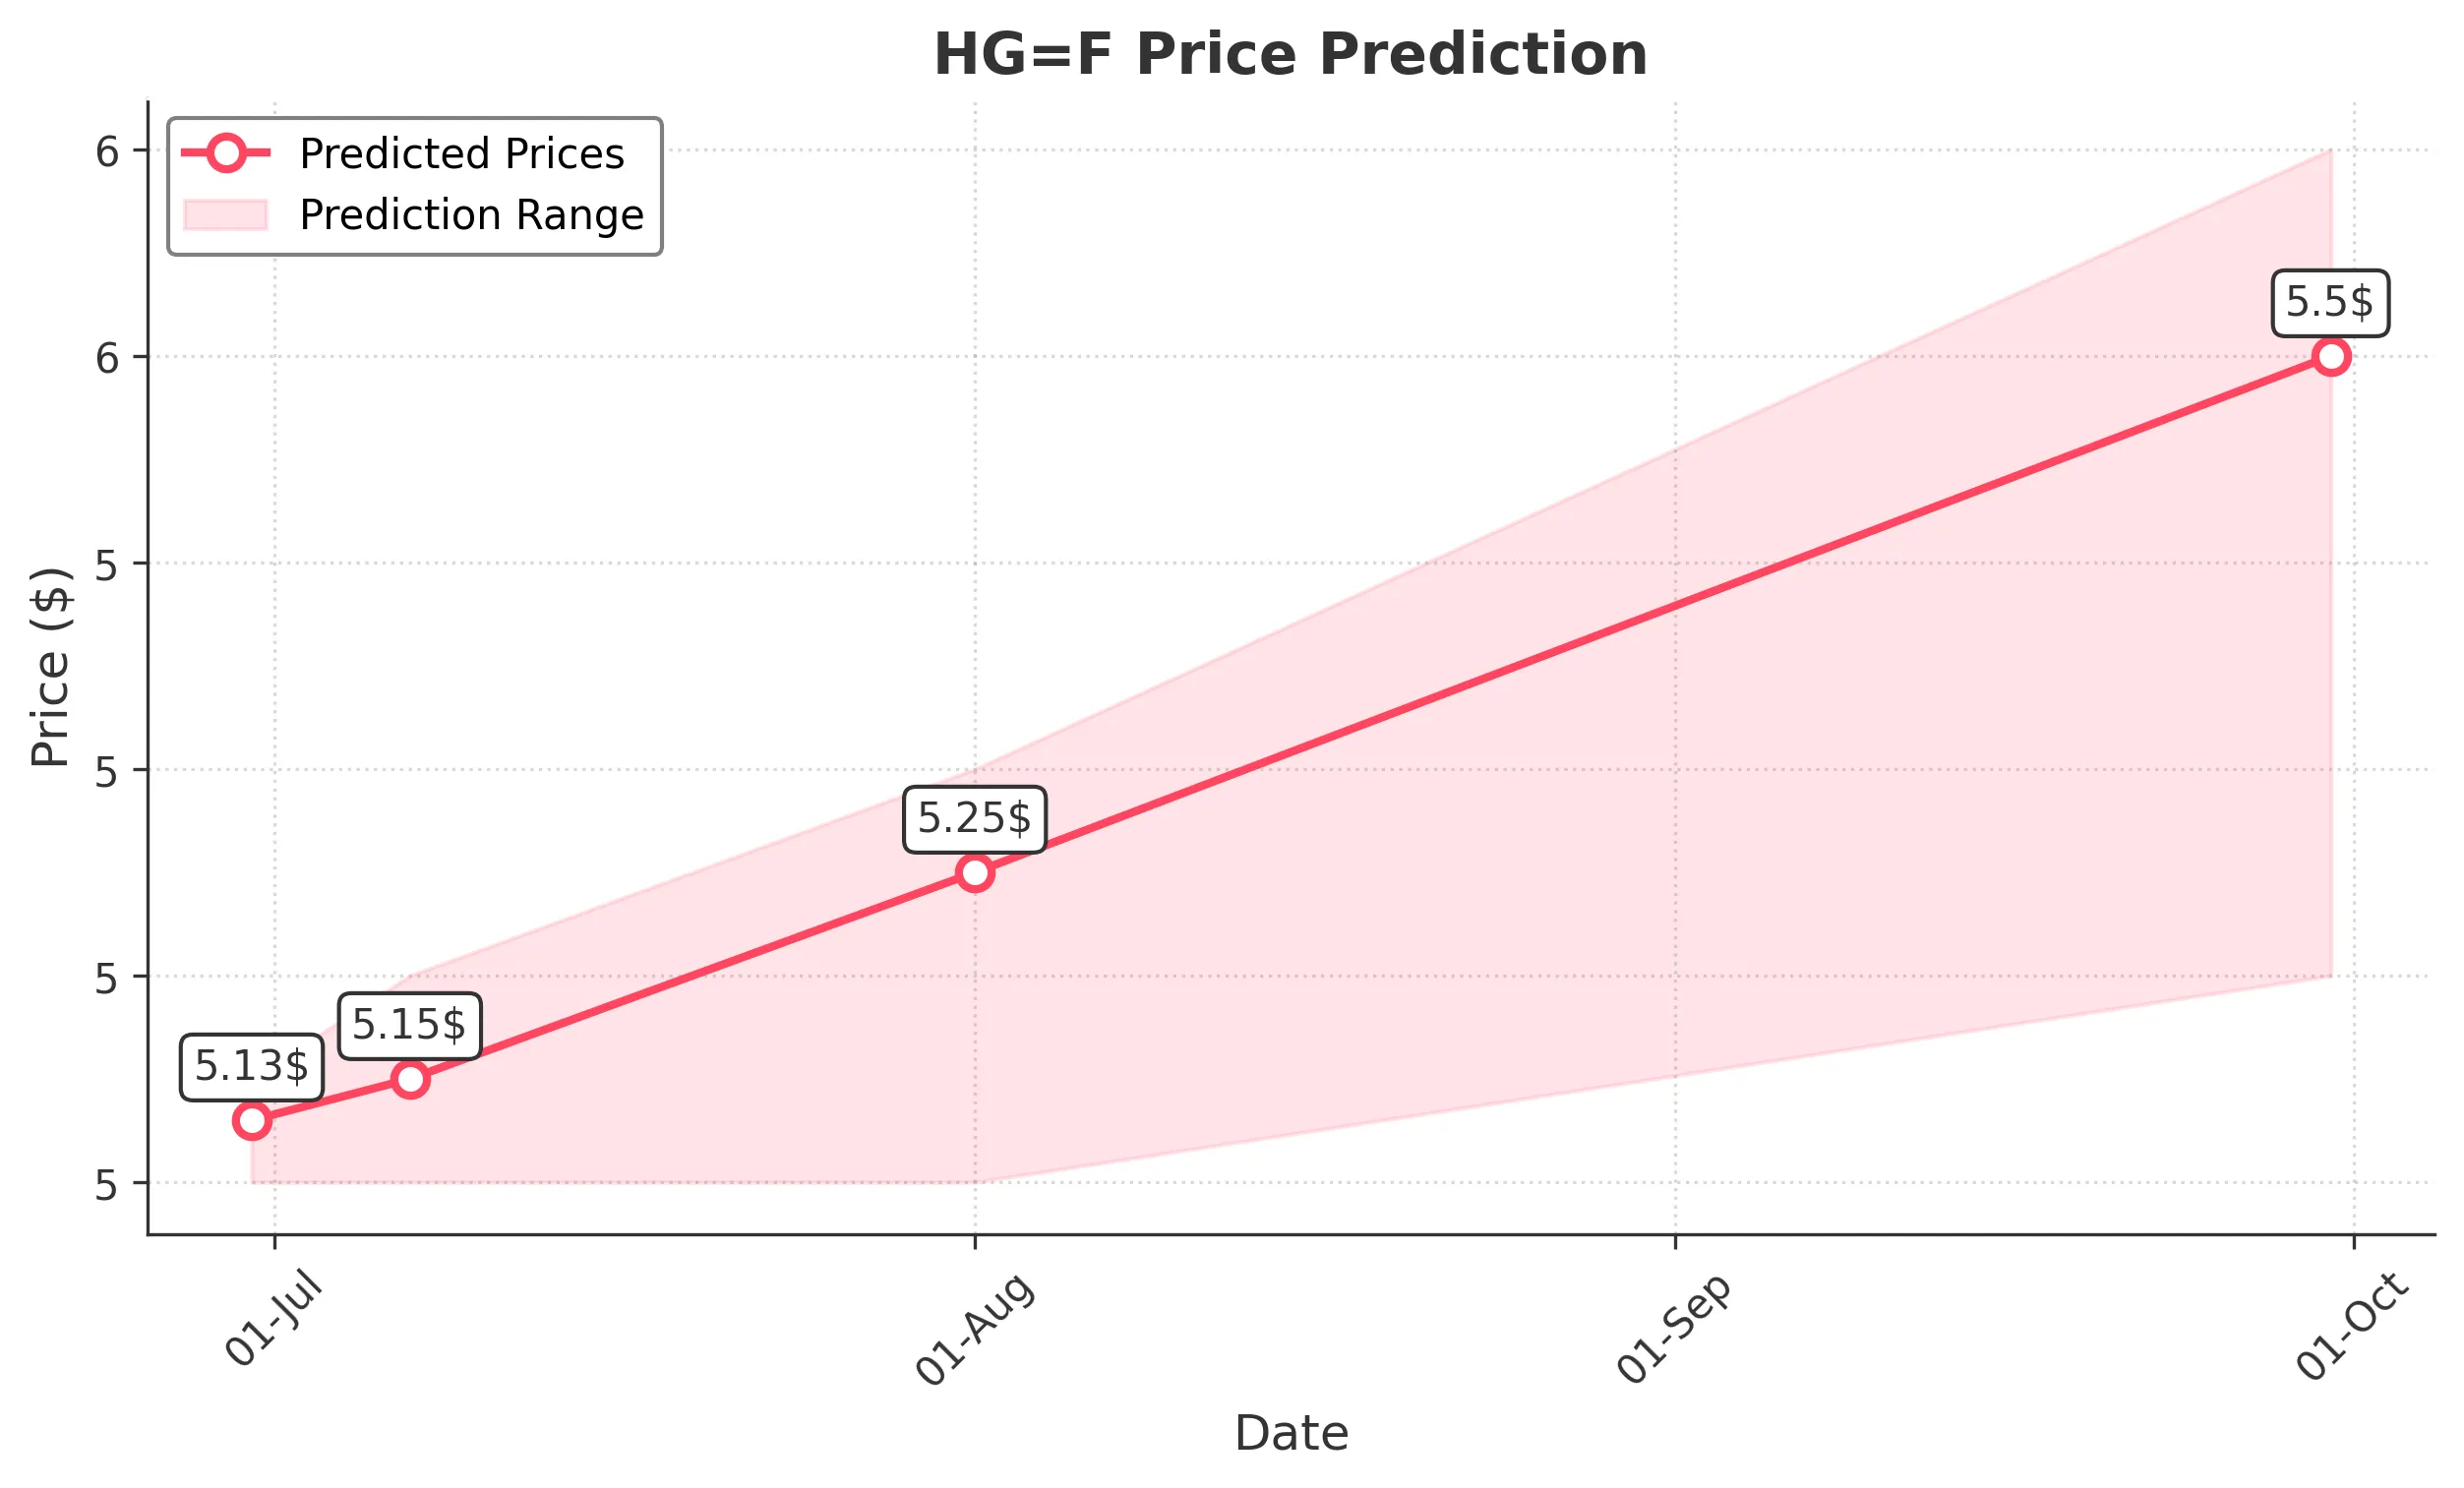
Target: June 30, 2025$5.13
$5.12
$5.15
$5.1
Description
The stock shows bullish momentum with a recent close at 5.1220. The RSI is approaching overbought levels, indicating potential upward pressure. A Doji pattern suggests indecision, but the overall trend remains positive. Volume is expected to increase as traders react to recent highs.
Analysis
Over the past 3 months, HG=F has shown a bullish trend with significant support at 4.8000 and resistance around 5.1300. The MACD indicates upward momentum, while the ATR suggests moderate volatility. Recent volume spikes indicate increased interest, but caution is warranted due to potential market corrections.
Confidence Level
Potential Risks
Potential profit-taking could lead to a pullback, and external market factors may influence volatility.
1 Week Prediction
Target: July 7, 2025$5.15
$5.13
$5.2
$5.1
Description
The stock is expected to continue its upward trajectory, supported by strong buying interest. The Bollinger Bands are widening, indicating increased volatility. However, the RSI nearing overbought levels suggests caution. A potential pullback could occur if profit-taking ensues.
Analysis
The stock has maintained a bullish trend, with key support at 4.8000 and resistance at 5.2000. The MACD remains positive, and recent candlestick patterns indicate bullish sentiment. Volume trends show increasing interest, but external factors could introduce volatility.
Confidence Level
Potential Risks
Market sentiment could shift due to macroeconomic news, impacting the stock's performance.
1 Month Prediction
Target: August 1, 2025$5.25
$5.15
$5.3
$5.1
Description
The stock is projected to reach higher levels as bullish momentum persists. The Fibonacci retracement levels suggest a target around 5.2500. However, the RSI indicates potential overbought conditions, which may lead to short-term corrections.
Analysis
In the last 3 months, HG=F has shown a strong bullish trend with significant resistance at 5.3000. The MACD and moving averages support continued upward movement, but the RSI suggests caution. Volume patterns indicate strong interest, but potential market corrections should be monitored.
Confidence Level
Potential Risks
Unforeseen market events or economic data releases could disrupt the upward trend.
3 Months Prediction
Target: September 30, 2025$5.5
$5.25
$5.6
$5.2
Description
Long-term bullish sentiment is expected to drive the stock higher, with a target of 5.5000. The overall trend remains strong, but the RSI indicates potential overbought conditions. Market corrections may occur, providing buying opportunities.
Analysis
The stock has shown a consistent upward trend over the past 3 months, with key support at 5.1000 and resistance at 5.6000. The MACD and moving averages indicate bullish momentum, while volume trends suggest strong interest. However, external factors could introduce volatility and affect the long-term outlook.
Confidence Level
Potential Risks
Economic conditions and geopolitical events could significantly impact market sentiment and stock performance.